Bitcoin charts provide valuable insights into price movements, market trends, and potential trading opportunities. This guide breaks down the essentials of reading Bitcoin charts for beginners, covering candlestick patterns, technical indicators, basic chart analysis techniques, and risk management strategies.
Manage your Bitcoin securely with the self-custody Bitcoin.com Wallet app.
Decoding Bitcoin Charts: A Beginner’s Guide
Bitcoin charts are essential tools for analyzing market trends, price movements, and trading opportunities. Understanding how to read these charts can help traders make informed decisions and develop a strategic approach to Bitcoin trading.
This guide covers the fundamentals of reading Bitcoin charts, including key concepts, indicators, and practical tips to enhance your trading skills.
Get started with a quick introduction to Bitcoin. Dive deeper into what Bitcoin is and explore its origin story-from an idea to a global financial revolution. Also, explore Bitcoin trading for beginners.
Types of Bitcoin Charts
Different chart types provide varied perspectives on Bitcoin’s price history, helping traders analyze trends and market movements effectively.
- Line Charts: Display only closing prices over time, offering a simple overview of price trends. Ideal for beginners and long-term trend analysis.
- Bar Charts: Show the opening, closing, high, and low prices for each period, offering more detail than line charts and helping traders analyze market volatility.
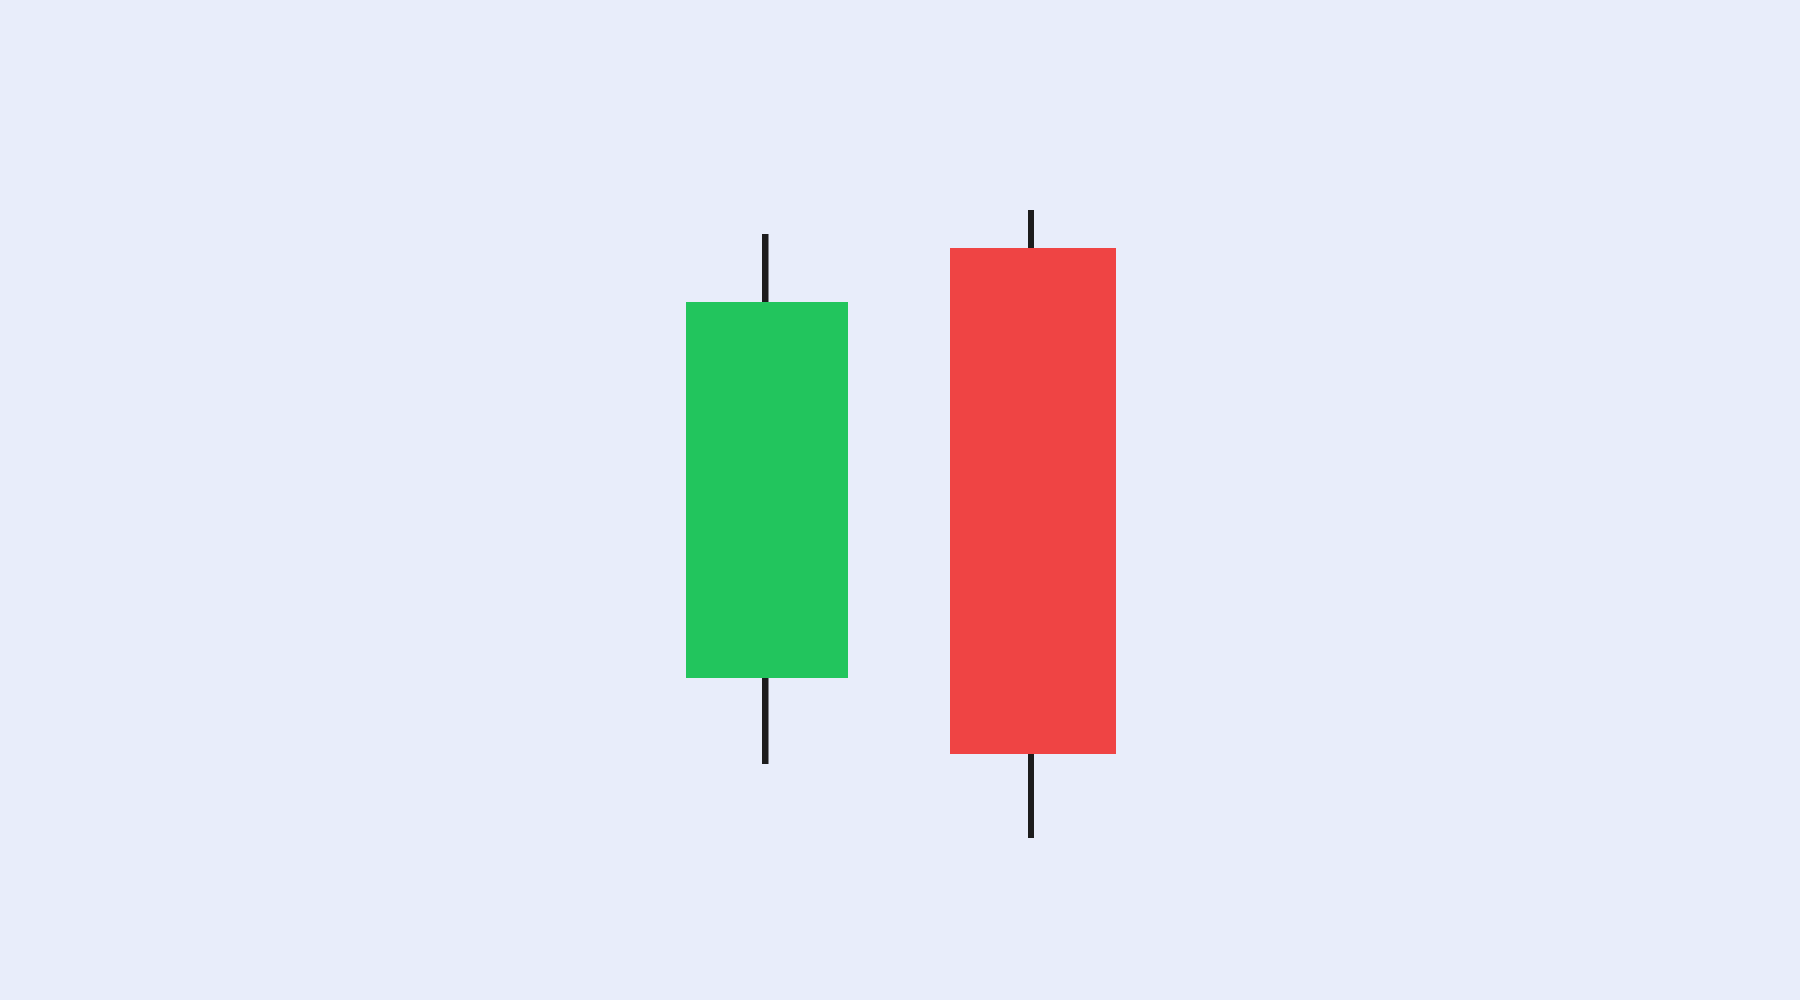
- Candlestick Charts (Most Common): The preferred chart type among traders, visually representing price movement with color-coded candlesticks. Green (or white) candlesticks indicate an upward movement (close > open). Red (or black) candlesticks indicate a downward movement (close < open).
Understanding these chart types allows traders to identify trends, price patterns, and potential trade opportunities more effectively.
Understanding Candlestick Patterns and Trading Volume
Candlestick patterns provide insights into potential price reversals or trend continuations, helping traders make informed decisions. Some common patterns include:
- Doji: A small-bodied candle indicating market indecision, often preceding a trend reversal.
- Hammer / Hanging Man: A small body with a long lower wick, signaling a potential price reversal (hammer in an uptrend, hanging man in a downtrend).
- Engulfing Pattern: A large candlestick fully engulfs the previous one, suggesting a strong trend reversal (bullish or bearish).
Trading Volume: Confirming Price Action
Trading volume, the amount of Bitcoin traded during a given period, helps confirm price trends:
- High volume with a price rise signals strong bullish momentum.
- High volume with a price drop indicates strong bearish pressure.
Learn more about trading volume and how it influences Bitcoin price movements, including its role in identifying bullish trends and bearish pressure in the market.
Technical Indicators and Chart Analysis
Technical indicators analyze price and volume data to generate trading signals, helping traders identify trends and market conditions. Popular indicators include:
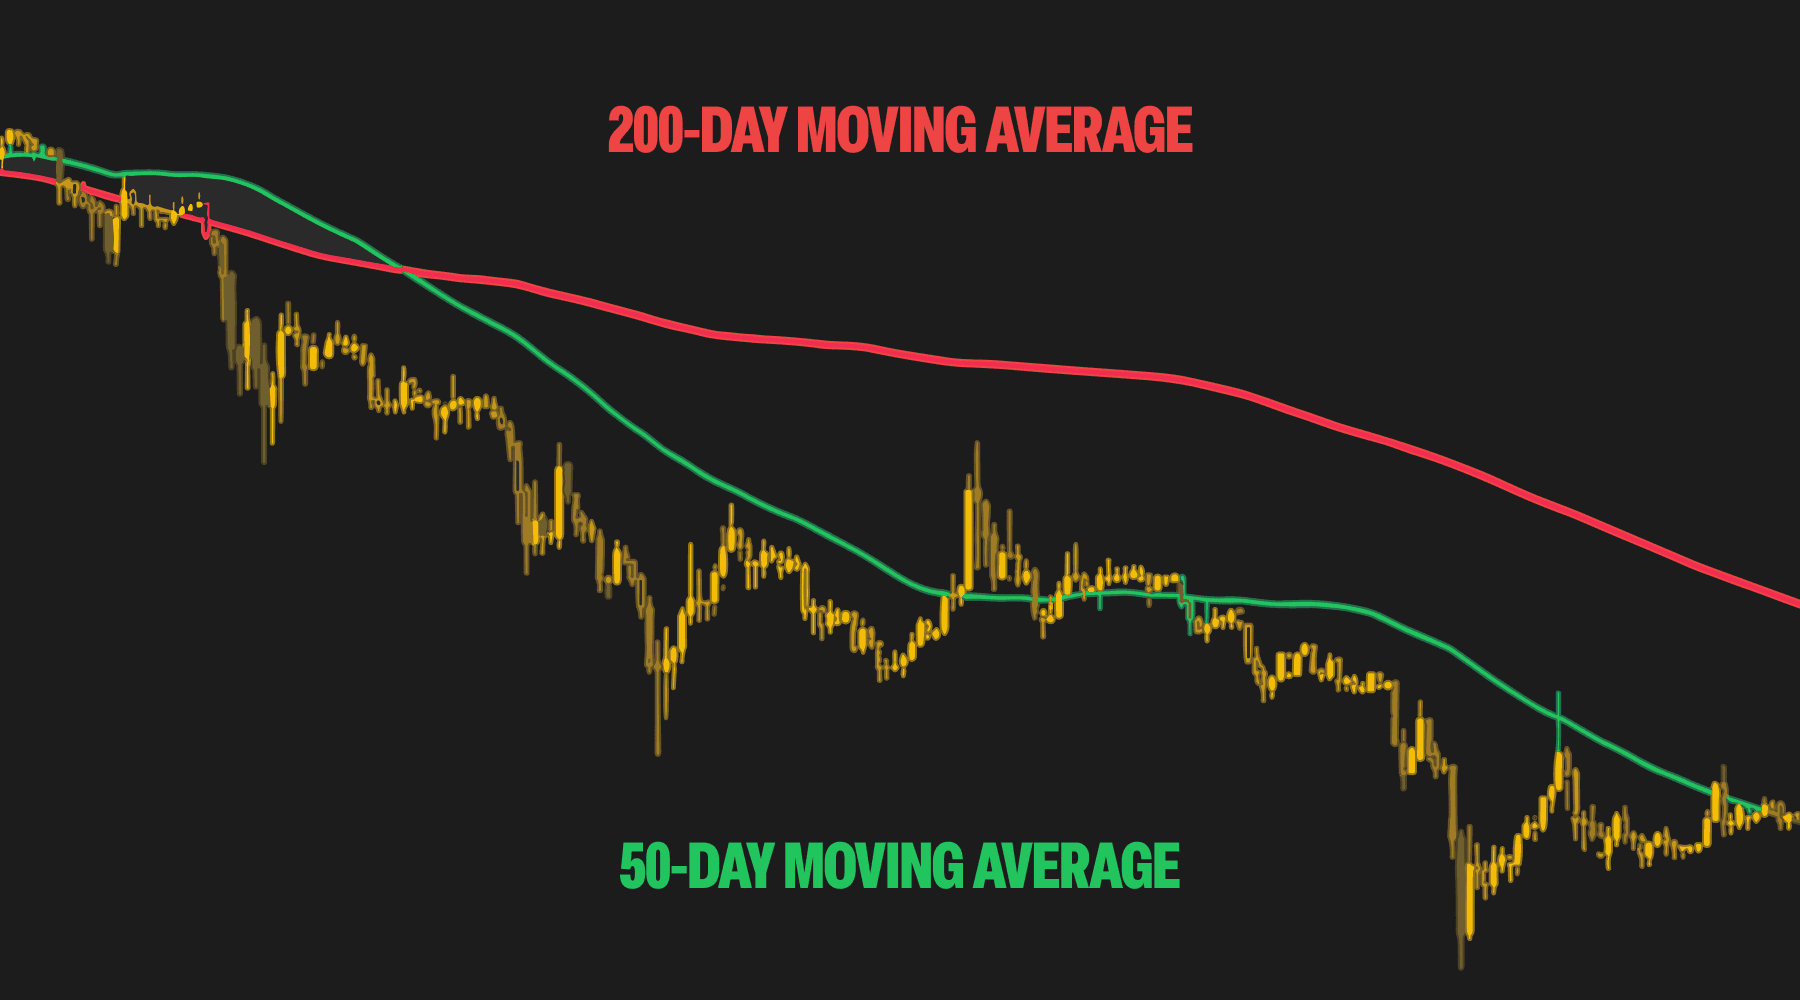
- Moving Averages (MA): Smooth out price data to identify trends and potential support/resistance levels.
- Relative Strength Index (RSI): Measures momentum and identifies overbought or oversold conditions.
- MACD (Moving Average Convergence Divergence): Detects trend changes and momentum shifts, helping traders spot entry and exit points.
- Bollinger Bands: Display price volatility and help identify potential breakouts or reversals.
Learn more about technical indicators and how they impact trading strategies.
Chart Analysis: Identifying Key Levels
Chart analysis helps traders recognize trends, support, and resistance levels, which are crucial for predicting price movements:
- Trends: Identify upward, downward, or sideways price movements.
- Support Levels: Areas where buying pressure is expected to outweigh selling pressure, potentially preventing further decline.
- Resistance Levels: Areas where selling pressure is expected to outweigh buying pressure, potentially capping further price increases.
Recognizing these key levels allows traders to anticipate potential price moves and develop more effective trading strategies.
Timeframes, Liquidity, and Fundamental Analysis
Timeframes
Different chart timeframes reveal distinct market patterns:
- Longer timeframes (daily, weekly, monthly) highlight broader trends and overall market direction.
- Shorter timeframes (hourly, 15-minute, 5-minute) focus on short-term price changes and volatility, useful for day traders.
Liquidity and Trading Volume
Liquidity and trading volume impact price stability and execution:
- High trading volume confirms strong trends and reduces price manipulation.
- Low liquidity can increase volatility, causing larger price swings and potential slippage.
Learn more about liquidity and its impact on Bitcoin liquidity.
Fundamental Analysis
Fundamental analysis evaluates Bitcoin’s long-term value and market potential by considering:
- Adoption rates (institutional & retail interest)
- Technological developments (network upgrades & innovations)
- Regulatory changes affecting the crypto market
Combining technical and fundamental analysis provides a broader market perspective, helping traders make informed decisions.
Learn more about fundamental analysis.
Risk Management and Trading Psychology
Successfully managing Bitcoin trading risks requires strategic planning and emotional discipline. Key risk management techniques include:
- Stop-Loss Orders: Set predefined exit points to limit potential losses and protect your capital.
- Position Sizing: Allocate only a controlled portion of your portfolio per trade to manage exposure.
- Emotional Discipline: Avoid impulsive decisions driven by fear or greed, and stick to your trading strategy.
Learn more about Bitcoin’s volatility and consider using dollar-cost averaging as a risk-reducing investment strategy.
Bitcoin Charts and the Broader Ecosystem
Bitcoin charts provide insights into price trends, but the wider crypto ecosystem can also influence Bitcoin’s price movements. Factors such as altcoins, DeFi, and NFTs contribute to market sentiment and liquidity.
- Altcoins & Bitcoin’s Relationship: Learn about altcoins and compare their impact on Bitcoin in Bitcoin vs. Altcoins.
- DeFi & NFTs: Explore how DeFi and NFTs shape the crypto market and influence Bitcoin demand.
- Bitcoin Exchanges: Understand how trading platforms affect liquidity with how Bitcoin exchanges work, and the differences between centralized exchanges (CEXs) and decentralized exchanges (DEXs).
- Securing Your Bitcoin: Protect your assets by learning about Bitcoin wallets, how to create a Bitcoin wallet, and choosing between custodial and non-custodial wallets. Ensure strong security practices and protect your private keys.
Understanding Bitcoin’s relationship with the broader crypto ecosystem can help traders and investors make more informed decisions.
Conclusion: Practice and Continuous Learning
Mastering Bitcoin chart analysis takes practice and ongoing learning. Start with the basics, experiment with different chart types and indicators, and refine your trading strategy over time. Staying informed about market trends, news, and broader crypto developments is essential for making well-informed trading decisions.
Explore Bitcoin’s potential future with Bitcoin Price Prediction and continue expanding your knowledge to navigate the evolving crypto market successfully.