The bullish engulfing candlestick pattern is a popular crypto trading signal that appears after a downtrend and suggests a potential bullish reversal. This simple two-candle formation helps traders spot momentum shifts and time entries more effectively. In this article, we’ll break down what the bullish engulfing pattern is, how to recognize it, and how traders use it to make better decisions in crypto markets.
Trade Bitcoin and other cryptocurrencies with the self-custody Bitcoin.com Wallet app.
Overview of the Bullish Engulfing Pattern
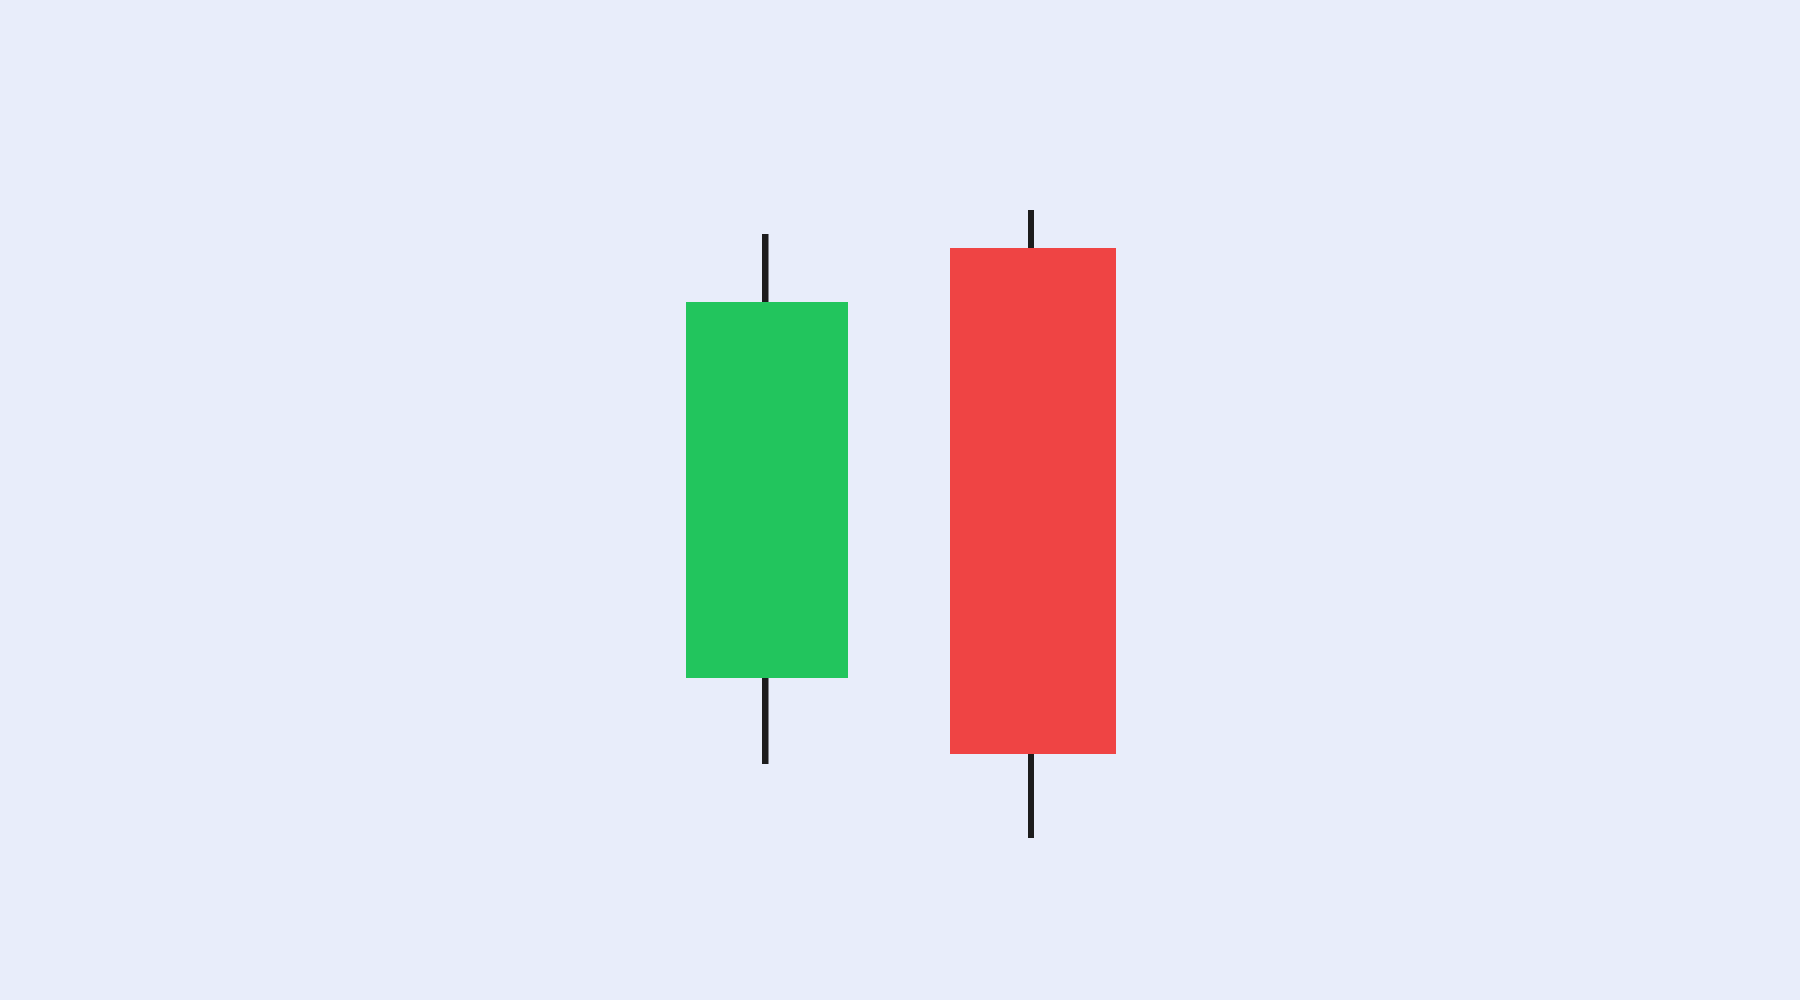
A bullish engulfing is a two-candle reversal pattern that appears after a price decline. It shows a clear shift in control from sellers to buyers.
The pattern begins with a red (bearish) candle, followed by a larger green (bullish) candle. The green candle completely covers or “engulfs” the red candle’s body. This signals that buyers have stepped in with strength, potentially reversing the trend.
For crypto traders, a bullish engulfing pattern may be an early signal to go long – especially when it forms at a key support level or after a sharp drop in price.
What Does It Look Like?
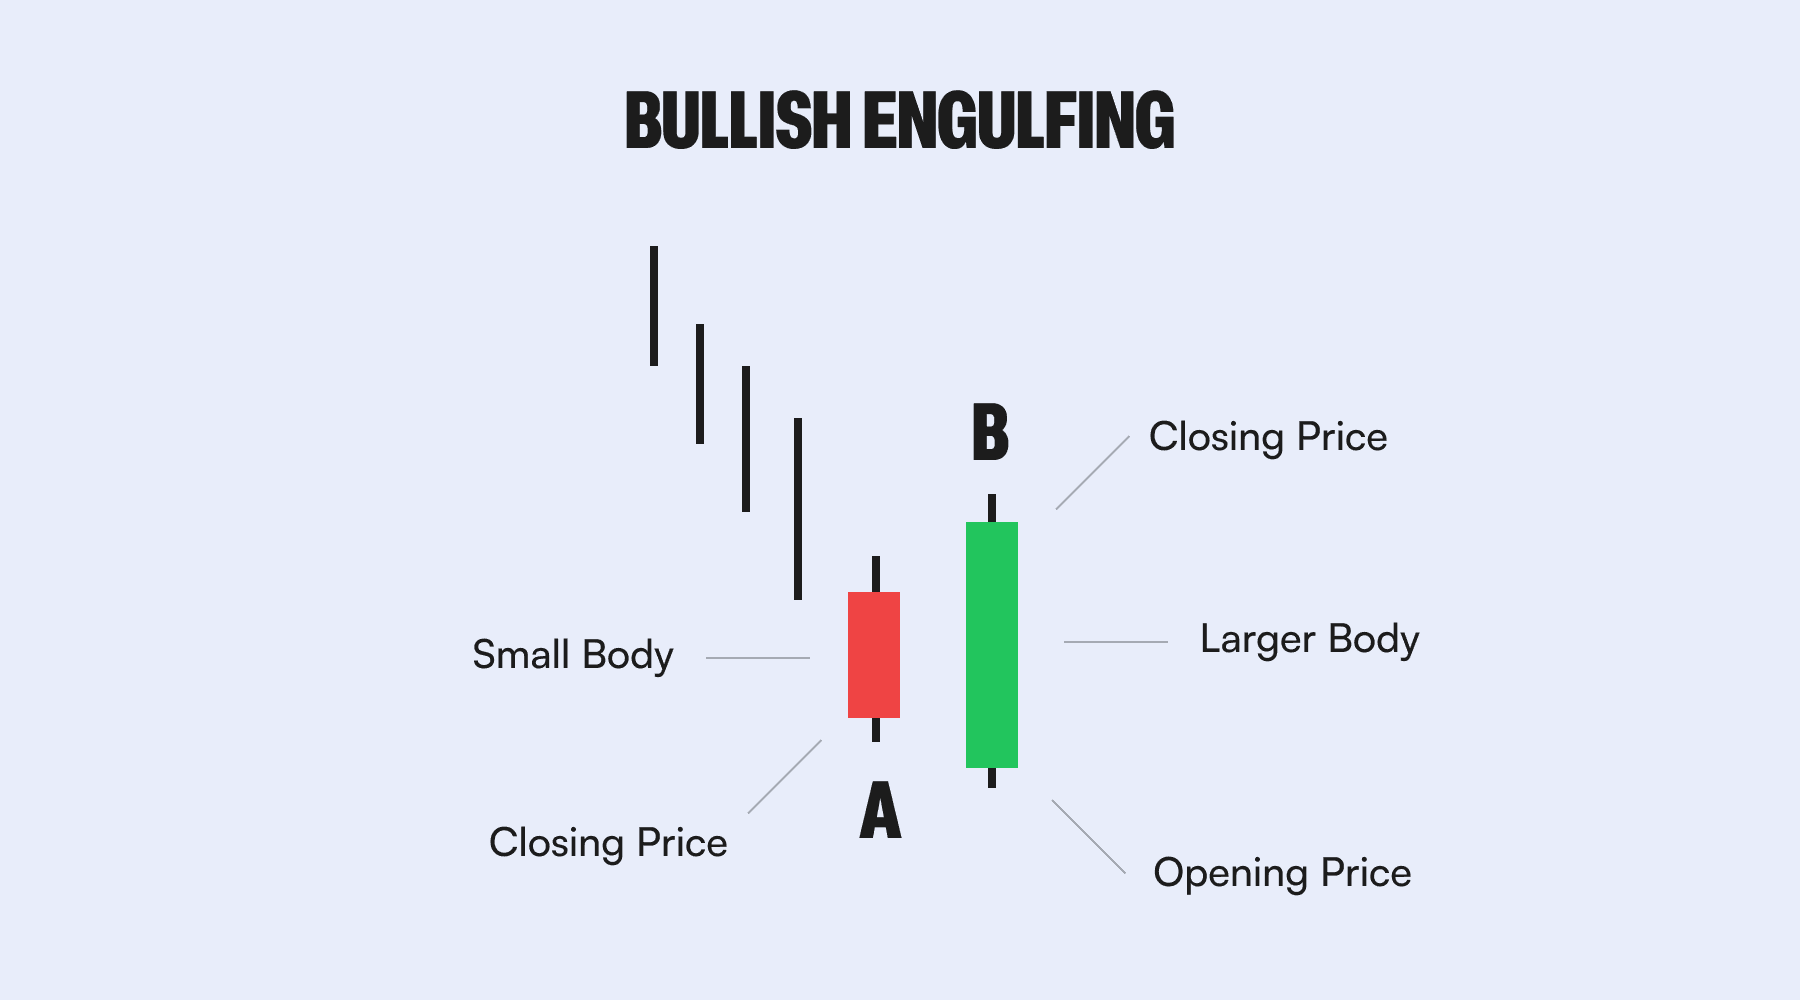
The bullish engulfing pattern consists of:
- A small red candle, showing selling pressure.
- A large green candle that opens lower but closes much higher – fully engulfing the body of the previous candle.
This visual change from a weak red candle to a strong green one reflects a surge in buying activity.
Signal Criteria
While crypto markets trade 24/7 (so there’s no true “opening” and “closing” like in stock markets), the basic structure still applies.
The bullish engulfing pattern follows this logic:
- The market is in a downtrend.
- The first candle is bearish (close is lower than open).
- The second candle is bullish and its body completely engulfs the body of the first candle.
- The pattern is stronger when volume increases on the second candle.
In simple terms:
- Green candle opens lower than the red candle’s close
- Green candle closes higher than the red candle’s open
That full takeover is what makes it “engulfing.”
In crypto markets, where trading is 24/7, gaps are rare. So what matters most is that the green candle fully wraps around the red candle’s body.
How to Interpret the Bullish Engulfing Pattern
The bullish engulfing is often seen as a signal of a possible trend reversal. When buyers overpower sellers with a strong move, it suggests that downward momentum may be weakening.
This doesn’t guarantee a rally, but it does show a shift in sentiment. Traders often use this pattern as:
- A signal to enter a long position
- A chance to exit or reduce short positions
- A cue to watch for further confirmation (like a breakout or higher volume)
Example in Action
Let’s say Bitcoin has been dropping for several days. Then, on the daily chart, it prints a small red candle followed by a large green candle that engulfs it. This could be a bullish engulfing pattern, especially if it forms near a known support level.
Some traders would enter a long trade at the close of the green candle, setting a stop loss just below the pattern’s low. Others might wait for the next candle to confirm the move by breaking above the green candle’s high.
Either way, the bullish engulfing gives them a clear visual clue to work with.
Conclusion
The bullish engulfing pattern is a simple but effective signal that can help traders spot potential reversals early. It works best when confirmed with other tools, such as support and resistance levels, trendlines, or momentum indicators like RSI.
Because of its simplicity and clarity, it remains one of the most popular patterns in crypto trading.
Next Steps
- Learn about the Bearish Engulfing, the bearish mirror image of the bullish engulfing pattern, in our next article.
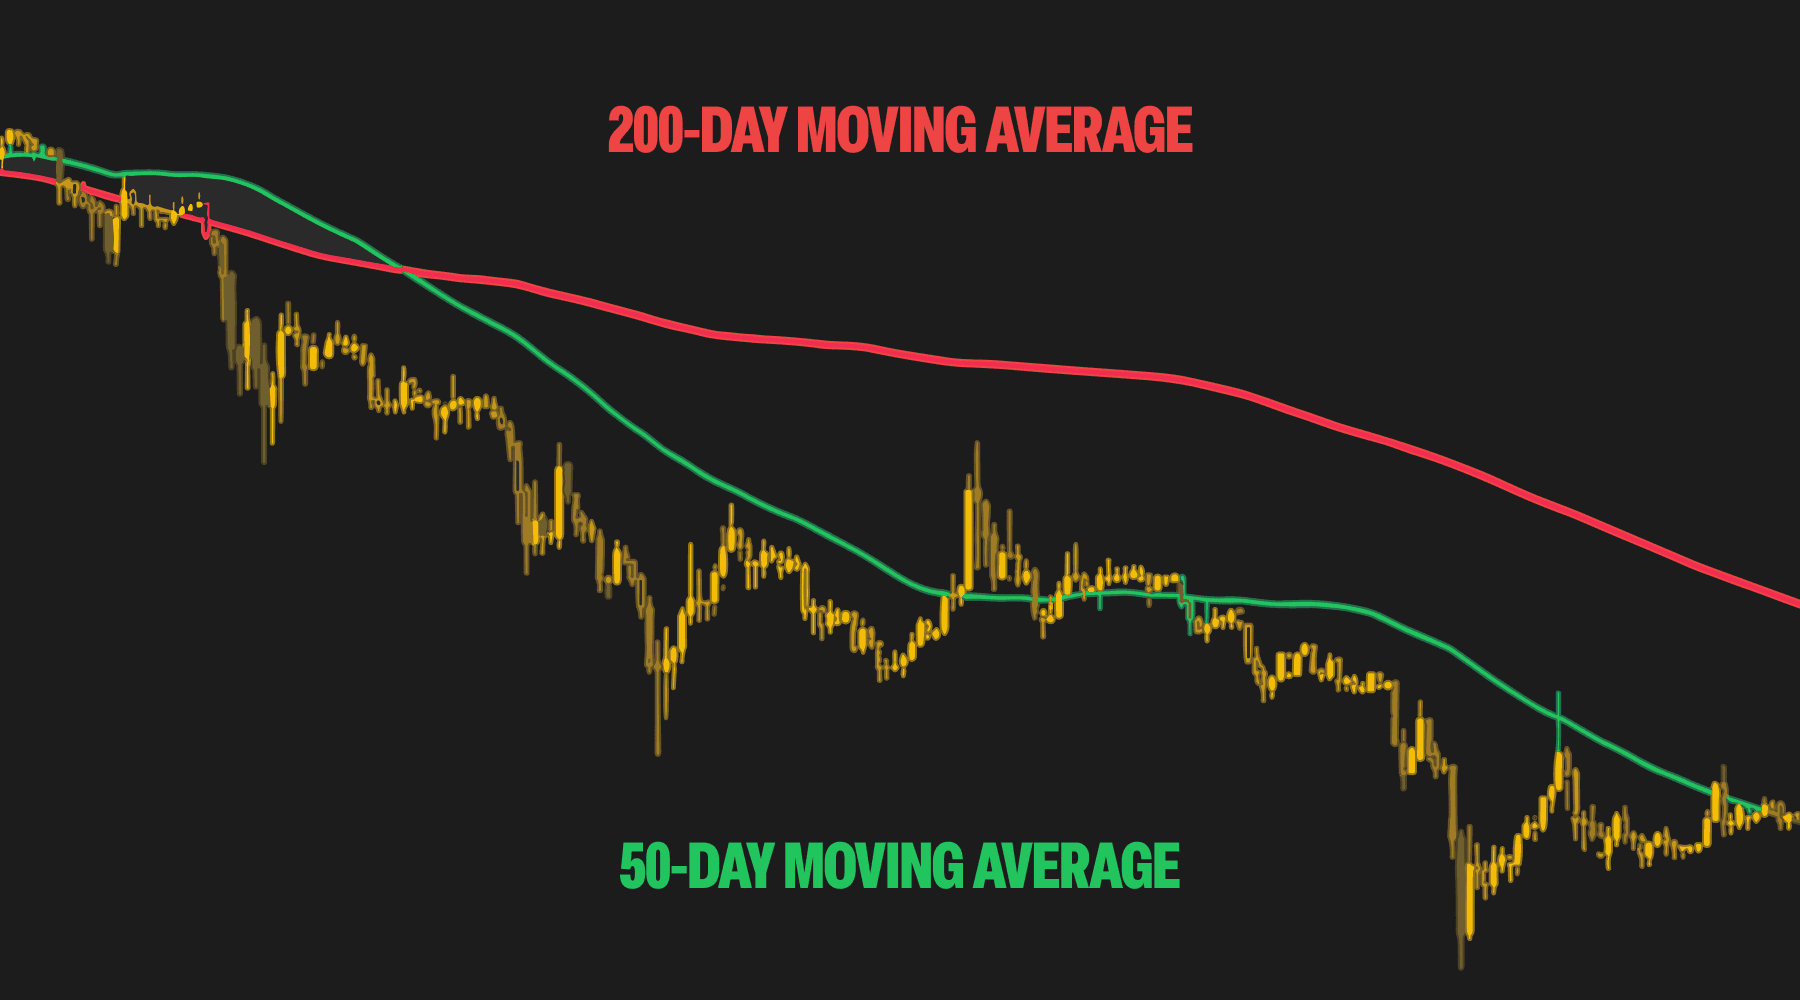
- Explore more technical indicators such as RSI, MACD, and moving averages to combine with candlestick signals.
- Practice identifying bullish engulfing patterns on a live chart using free charting tools.
By integrating the bullish engulfing pattern into a broader trading strategy that includes confirmation signals and risk management, traders can improve their ability to anticipate price reversals and make more confident decisions.
Disclaimer
No Investment Advice
The information provided in this article is for educational purposes only and does not constitute investment advice, financial advice, trading advice, or any other type of advice. Bitcoin.com does not recommend or endorse the buying, selling, or holding of any cryptocurrency, token, or financial instrument. You should not rely on the content of this article as a basis for any investment decision. Always do your own research and consult a licensed financial advisor before making any investment decisions.
Accuracy of Information
While we strive to ensure the accuracy and reliability of the information presented, Bitcoin.com makes no guarantees regarding the completeness, timeliness, or accuracy of any content. All information is provided “as is” and is subject to change without notice. You understand that you use any information available here at your own risk.