The Golden Cross is a classic bullish trading signal that occurs when a short-term moving average crosses above a long-term moving average. It signals that buying momentum is increasing and that a longer-term uptrend may be starting. Crypto traders use the Golden Cross to confirm trend reversals and strengthen their conviction in long trades – especially on higher timeframes. In this article, we’ll explain how the Golden Cross works, what it looks like on a chart, and how traders use it to time market entries and exits.
Overview of the Golden Cross Pattern
The Golden Cross occurs when the 50-day moving average (MA) crosses above the 200-day moving average. It reflects a shift in market sentiment: buyers are now more active over the short term than they were over the long term.
This crossover is often seen as confirmation that a downtrend has ended and that a new uptrend may be forming.
The Golden Cross typically unfolds in three stages:
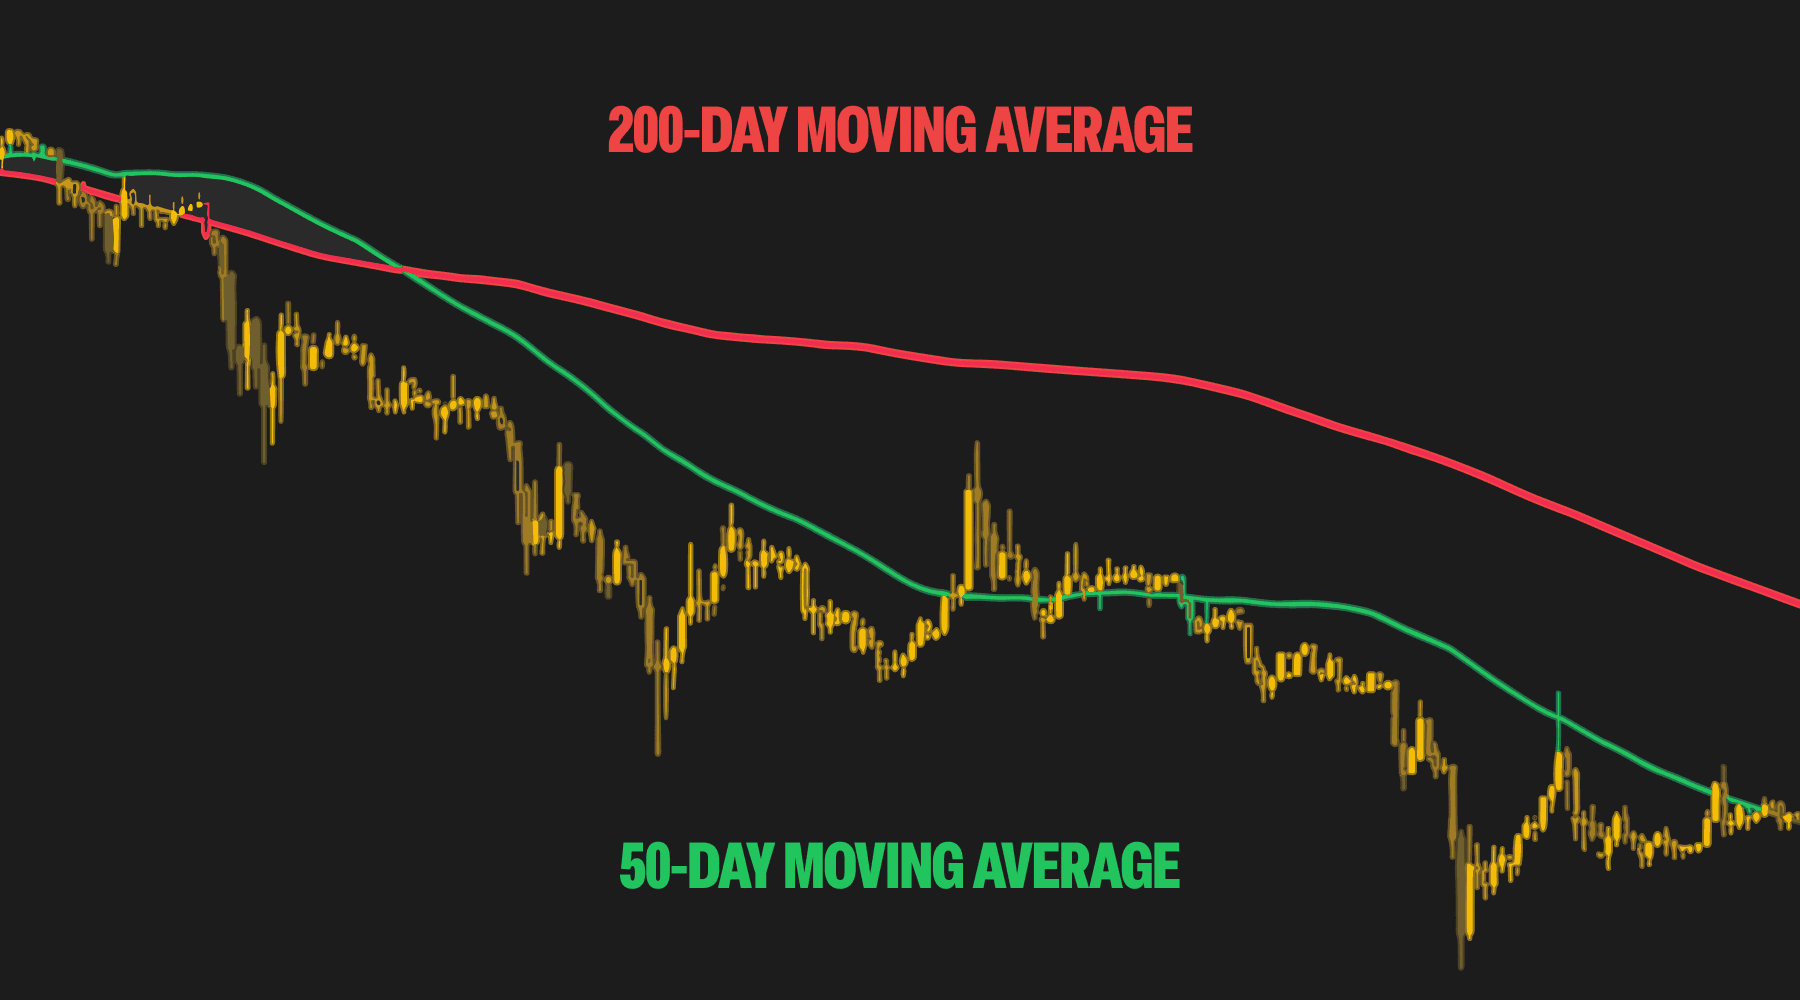
- The 50-day MA is below the 200-day MA during a downtrend.
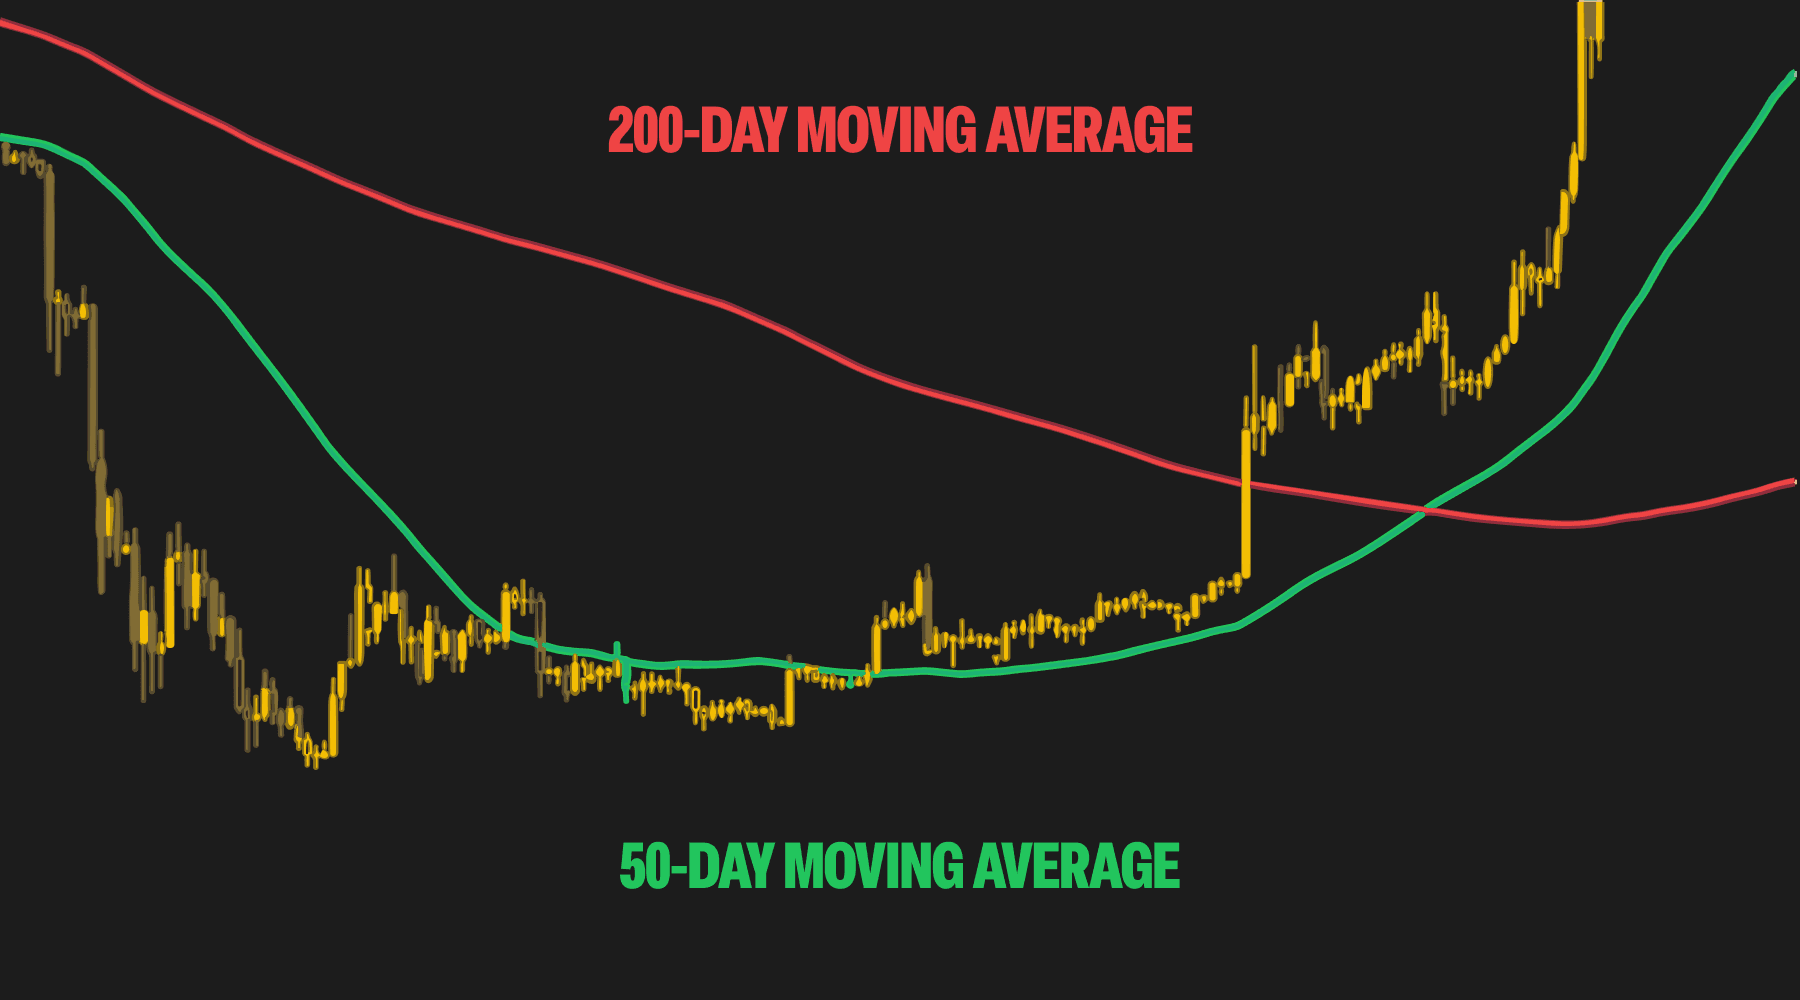
- Momentum shifts, and the 50-day MA crosses above the 200-day MA.
- A new uptrend forms, with the 50-day MA staying above the 200-day MA.
While the 50/200-day combination is the most common, some traders apply the same concept on shorter or longer timeframes depending on their strategy.
What Does It Look Like?
The Golden Cross appears on a chart when the short-term moving average (often shown in blue or green) moves upward and crosses above the long-term moving average (usually shown in orange or red).
This crossover point becomes the key visual marker of the pattern.
Here’s how it typically plays out on the chart:
- Before the cross: The 50-day MA lags below the 200-day MA, confirming a previous downtrend.
- At the cross: The 50-day MA rises and intersects the 200-day MA from below.
- After the cross: The price often continues upward, with the 50-day MA leading and the 200-day MA acting as dynamic support.
Some traders also look for volume spikes at or shortly after the crossover to confirm the strength of the trend change.
How Traders Use the Golden Cross
Crypto traders use the Golden Cross to identify potential trend reversals and support longer-term bullish positioning. Here’s how it’s typically applied:
Entry Point
- Many traders enter long positions after the 50-day MA crosses above the 200-day MA, ideally on a daily or weekly chart.
- A common confirmation is a daily candle closing above both moving averages.
Stop-Loss Placement
- Traders often place stop-loss orders just below the 200-day MA, which may now act as support.
- In more aggressive setups, the stop may sit under the most recent swing low.
Confirmation Tools
To increase conviction, traders often combine the Golden Cross with other indicators:
- RSI: Helps confirm if momentum is building.
- MACD: Shows whether the crossover aligns with other bullish signals.
- Volume: A surge in volume around the crossover strengthens the signal.
Example in Crypto Markets
A textbook Golden Cross occurred on Bitcoin’s daily chart in May 2020, shortly after the March crash. The 50-day MA crossed above the 200-day MA as price reclaimed the $9,000 level. This signal preceded a major uptrend that eventually took Bitcoin above $60,000 in 2021.
While past performance isn’t predictive, it shows how traders view the Golden Cross as a potential turning point in market structure.
Limitations of the Golden Cross
Like all indicators, the Golden Cross is not perfect. It has several limitations that traders should keep in mind:
- It lags: The signal confirms a trend that has already started. This means traders may miss early entry opportunities.
- False signals in choppy markets: If the market is moving sideways, the moving averages may cross and uncross repeatedly, leading to “whipsaw” trades.
- Better on higher timeframes: The Golden Cross is most reliable on daily or weekly charts. On shorter timeframes (like 15-minute or 1-hour), it’s more prone to noise.
Traders can reduce these risks by waiting for confirmation (such as strong volume or breakouts above resistance) and combining the pattern with broader market analysis.
What About the Death Cross?
The Death Cross is the opposite pattern – when the 50-day MA crosses below the 200-day MA – signaling a potential downtrend. Some traders use both signals together: buy at the golden cross, sell at the death cross.
Conclusion
The Golden Cross is one of the simplest and most widely followed bullish signals in technical analysis. It marks a clear shift in momentum and can help crypto traders identify the early stages of long-term uptrends.
While it shouldn’t be used in isolation, the Golden Cross can be a powerful addition to any trend-following strategy – especially when confirmed with volume, support levels, and momentum indicators.
Next Steps
- Explore the Death Cross – the bearish counterpart to the Golden Cross.
- Review related trend-following tools like moving averages, MACD, and RSI.
- Practice identifying Golden Cross signals using live crypto charts and backtesting tools.
- Learn more about crypto trading strategies that combine chart patterns with indicators for stronger setups.
By integrating the Golden Cross into a well-rounded technical analysis approach, traders can better time entries and manage risk during the early phases of new bullish trends.
Disclaimer
No Investment Advice
The information provided in this article is for educational purposes only and does not constitute investment advice, financial advice, trading advice, or any other type of advice. Bitcoin.com does not recommend or endorse the buying, selling, or holding of any cryptocurrency, token, or financial instrument. You should not rely on the content of this article as a basis for any investment decision. Always do your own research and consult a licensed financial advisor before making any investment decisions.
Accuracy of Information
While we strive to ensure the accuracy and reliability of the information presented, Bitcoin.com makes no guarantees regarding the completeness, timeliness, or accuracy of any content. All information is provided “as is” and is subject to change without notice. You understand that you use any information available here at your own risk.