The Relative Strength Index (RSI) is one of the most popular momentum indicators in trading. It measures how quickly and strongly a price is moving, helping traders identify when an asset might be overbought (and due for a pullback) or oversold (and due for a bounce). In this article, we’ll break down what the RSI is, how it’s calculated, and how traders use it to make better decisions in crypto markets.
Trade Bitcoin and crypto with the Bitcoin.com Wallet app.
Overview of the RSI
The Relative Strength Index (RSI) was developed by J. Welles Wilder in 1978 as a tool to gauge market momentum. It’s an oscillator, meaning it moves back and forth within a fixed range – in this case, from 0 to 100.
By default, RSI looks at the last 14 periods (on a daily chart, that’s 14 days; on a 1-hour chart, that’s 14 hours). It compares average price gains to average price losses to determine whether buyers or sellers are in control.
Traders often use it to:
- Spot overbought conditions (RSI above 70) that may precede a pullback.
- Spot oversold conditions (RSI below 30) that may precede a rebound.
- Detect divergences between price and momentum, which can signal possible reversals.
How RSI Is Calculated
The RSI Formula is:
RSI = 100 – (100 ÷ (1 + RS))
Where:
RS = (Average Gain over N periods) ÷ (Average Loss over N periods)
Key points:
- N is the lookback period, with 14 as the most common setting.
- Shorter periods (e.g., 7) make RSI more sensitive to price changes and generate more frequent signals.
- Longer periods (e.g., 21) smooth out the indicator and reduce false signals.
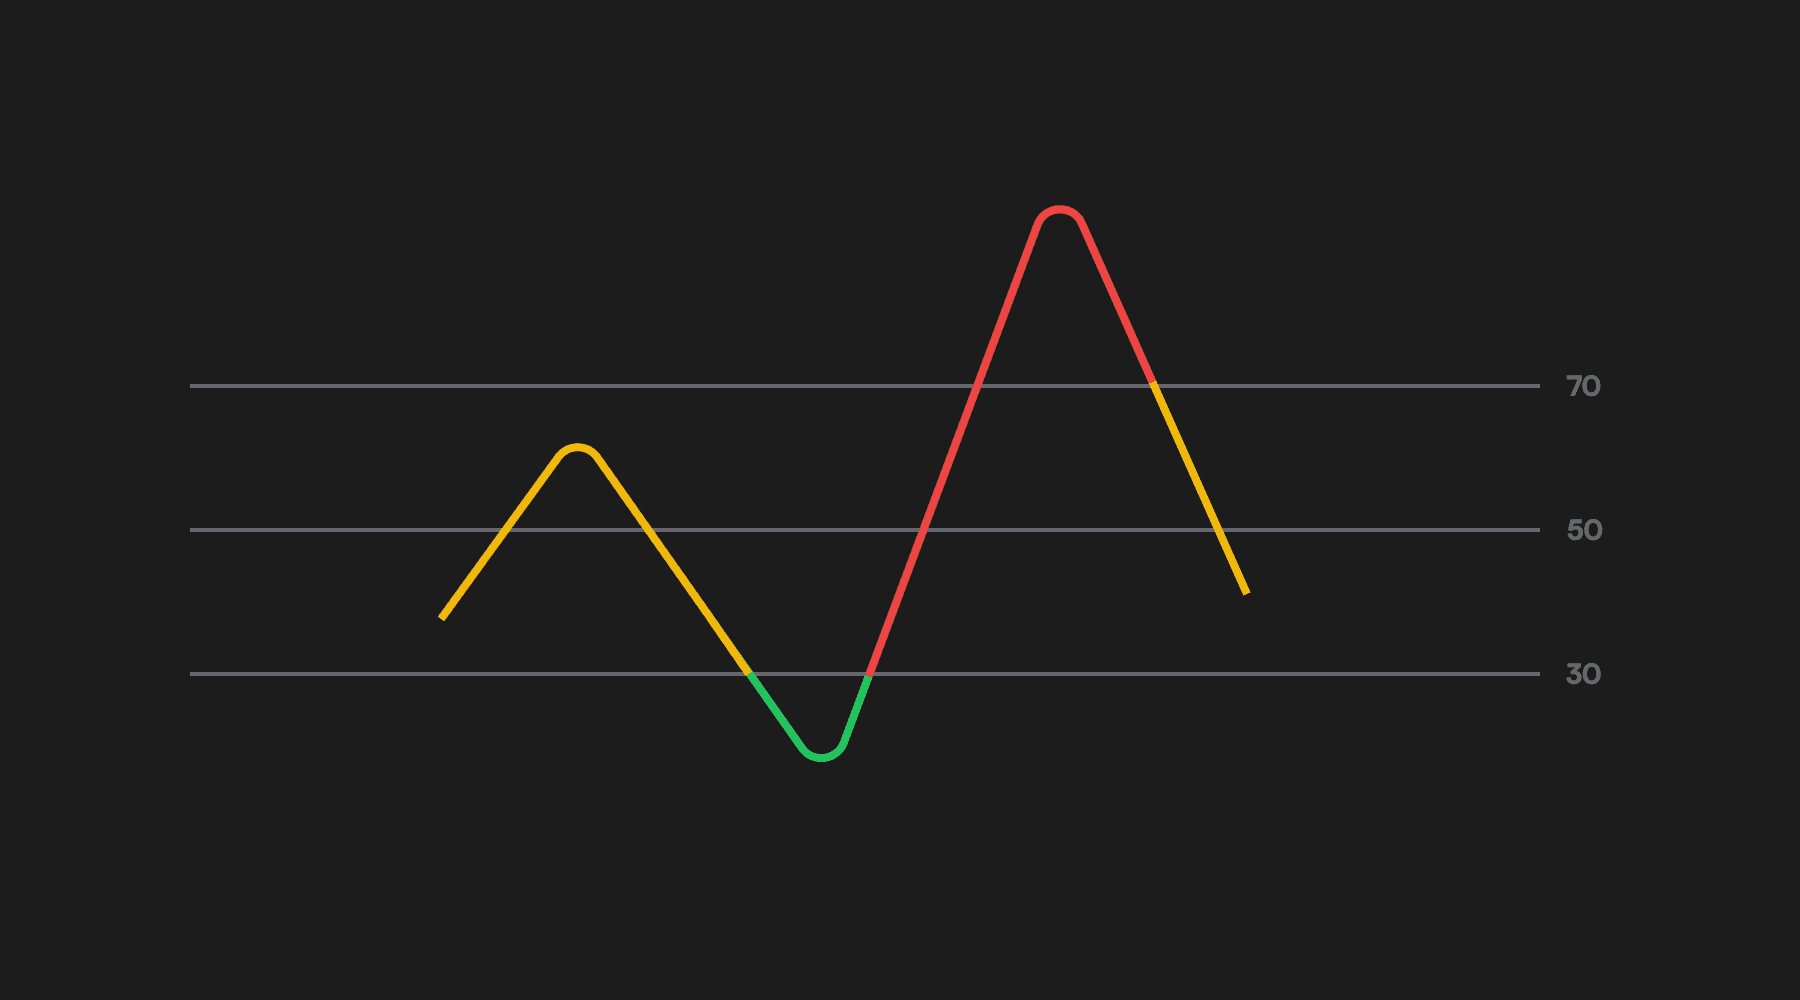
How to Interpret RSI
Overbought (Above 70)
When RSI rises above 70, it suggests that buying pressure has been strong and the price may be overextended. This can be a signal for traders to prepare for a possible pullback.
Oversold (Below 30)
When RSI drops below 30, it suggests that selling pressure has been strong and the price may be undervalued in the short term. This can be a signal for a possible rebound.
Midline (50)
RSI values above 50 generally support an uptrend, while values below 50 support a downtrend. Traders sometimes use this as a quick way to check trend direction.
RSI Divergences
A divergence happens when price and RSI move in opposite directions:
- Bullish divergence: Price makes lower lows while RSI makes higher lows. This can hint at weakening selling momentum and a possible upward reversal.
- Bearish divergence: Price makes higher highs while RSI makes lower highs. This can signal weakening buying momentum and a possible downward reversal.
Note: Divergences are less reliable in strong trending markets and work best when combined with other confirmation tools.
Practical RSI Trade Setup Example
Here’s a simple way some traders use RSI:
In an uptrend:
- Wait for RSI to dip below 30 (oversold).
- Enter when RSI crosses back above 30, ideally near a support level.
- Exit when RSI approaches or crosses below 70, or when price hits a known resistance level.
In a downtrend:
- Wait for RSI to rise above 70 (overbought).
- Enter a short when RSI crosses back below 70, ideally near a resistance level.
- Exit when RSI approaches or crosses above 30, or when price hits a known support level.
Example in Action
Suppose Bitcoin has been in an uptrend and RSI dips to 28 during a brief pullback. Price holds at a support level, and RSI soon climbs back to 35. Some traders might take this as a signal that the pullback is ending and momentum is shifting back to the upside.
Conversely, if Ethereum is in a downtrend and RSI spikes to 75, traders might see it as a sign the rally is overstretched and prepare for a move lower.
Conclusion
The Relative Strength Index is a versatile tool that helps traders gauge momentum, spot overbought and oversold markets, and detect possible reversals.
On its own, RSI can produce false signals, especially in strong trends. It’s most effective when combined with other indicators, such as moving averages or support/resistance analysis, to confirm trade setups.
Next Steps
- Explore other momentum indicators like the Moving Average Convergence Divergence (MACD) to combine with RSI.
- Learn about Golden Cross and Bearish Cross patterns to identify trend shifts.
- Practice spotting RSI signals on live charts and testing them with different timeframes and settings.
By incorporating RSI into a broader strategy with confirmation tools and risk management, traders can improve their ability to anticipate market shifts and act with greater confidence.
Disclaimer
No Investment Advice
The information provided in this article is for educational purposes only and does not constitute investment advice, financial advice, trading advice, or any other type of advice. Bitcoin.com does not recommend or endorse the buying, selling, or holding of any cryptocurrency, token, or financial instrument. You should not rely on the content of this article as a basis for any investment decision. Always do your own research and consult a licensed financial advisor before making any investment decisions.
Accuracy of Information
While we strive to ensure the accuracy and reliability of the information presented, Bitcoin.com makes no guarantees regarding the completeness, timeliness, or accuracy of any content. All information is provided “as is” and is subject to change without notice. You understand that you use any information available here at your own risk.