The Rising Hammer candlestick pattern is a popular bullish reversal signal used in crypto and traditional markets. Formed after a downtrend, it helps traders spot potential market bottoms by revealing when buyers are starting to regain control. In this guide, we’ll break down how to identify the pattern, interpret its meaning, and use it alongside other indicators to improve your trading strategy.
Trade Bitcoin and other cryptocurrencies with the self-custody Bitcoin.com Wallet app.
Overview of the Rising Hammer Candlestick Pattern
The rising hammer candlestick – more commonly known as the bullish hammer – is a classic chart pattern that signals a potential reversal in a downtrend. Traders often look to the rising hammer as a potential signal of shifting momentum, especially in markets such as crypto, stocks, forex, and commodities.
This pattern appears when bearish pressure begins to fade and buyers start to regain control. While simple in appearance, the hammer contains critical information about market sentiment and can help traders identify entry points with favorable risk-reward ratios. However, as with any trading signal, it’s most effective when used in conjunction with other forms of technical or fundamental analysis.
This article explores what the rising hammer is, how to identify it, what it means for market participants, and how traders can use it effectively.
What is a Rising Hammer?
The rising hammer is a bullish reversal candlestick pattern that typically forms after a sustained downtrend. It consists of a single candle that resembles a hammer striking the market from below, hence the name. The structure tells a story of failed selling pressure followed by a resurgence of buyer strength.
CharacteristicDescriptionTrendMust appear after a strong downtrendLower WickAt least 2–3 times the size of the bodyReal BodySmall and located near the topUpper ShadowVery short or nonexistentCandle ColorGreen (bullish) preferred, but red is acceptableCharacteristicTrendDescriptionMust appear after a strong downtrendCharacteristicLower WickDescriptionAt least 2–3 times the size of the bodyCharacteristicReal BodyDescriptionSmall and located near the topCharacteristicUpper ShadowDescriptionVery short or nonexistentCharacteristicCandle ColorDescriptionGreen (bullish) preferred, but red is acceptable
The candle’s body may be red or green, but what matters most is the long lower wick and the placement after a downtrend. Without that context, it isn’t a Rising Hammer.
The Rising Hammer reflects a shift in control from sellers to buyers. After an initial push downward, buyers stepped in and drove the price back near the open – signaling potential bullish momentum.
Psychology Behind the Pattern
The rising hammer is not just a shape – it represents a battle between buyers and sellers:
- The long lower wick shows that bears were dominant early in the period.
- The small body at the top reflects that bulls successfully reversed much of that selling pressure.
- If the candle closes green, it indicates that the bulls even managed to end the period ahead, strengthening the reversal signal.
The pattern is particularly meaningful when it appears near support levels, historical lows, or in areas of oversold conditions. However, by itself, a hammer is not a guarantee of reversal – it needs confirmation.
Formula / Identification Criteria
To qualify as a bullish hammer, a candlestick must meet the following criteria:
- Lower Shadow ≥ 2 × Body
- Upper Shadow ≈ 0
- Close ≥ Open (green preferred)
- Trend: Must appear after a downtrend
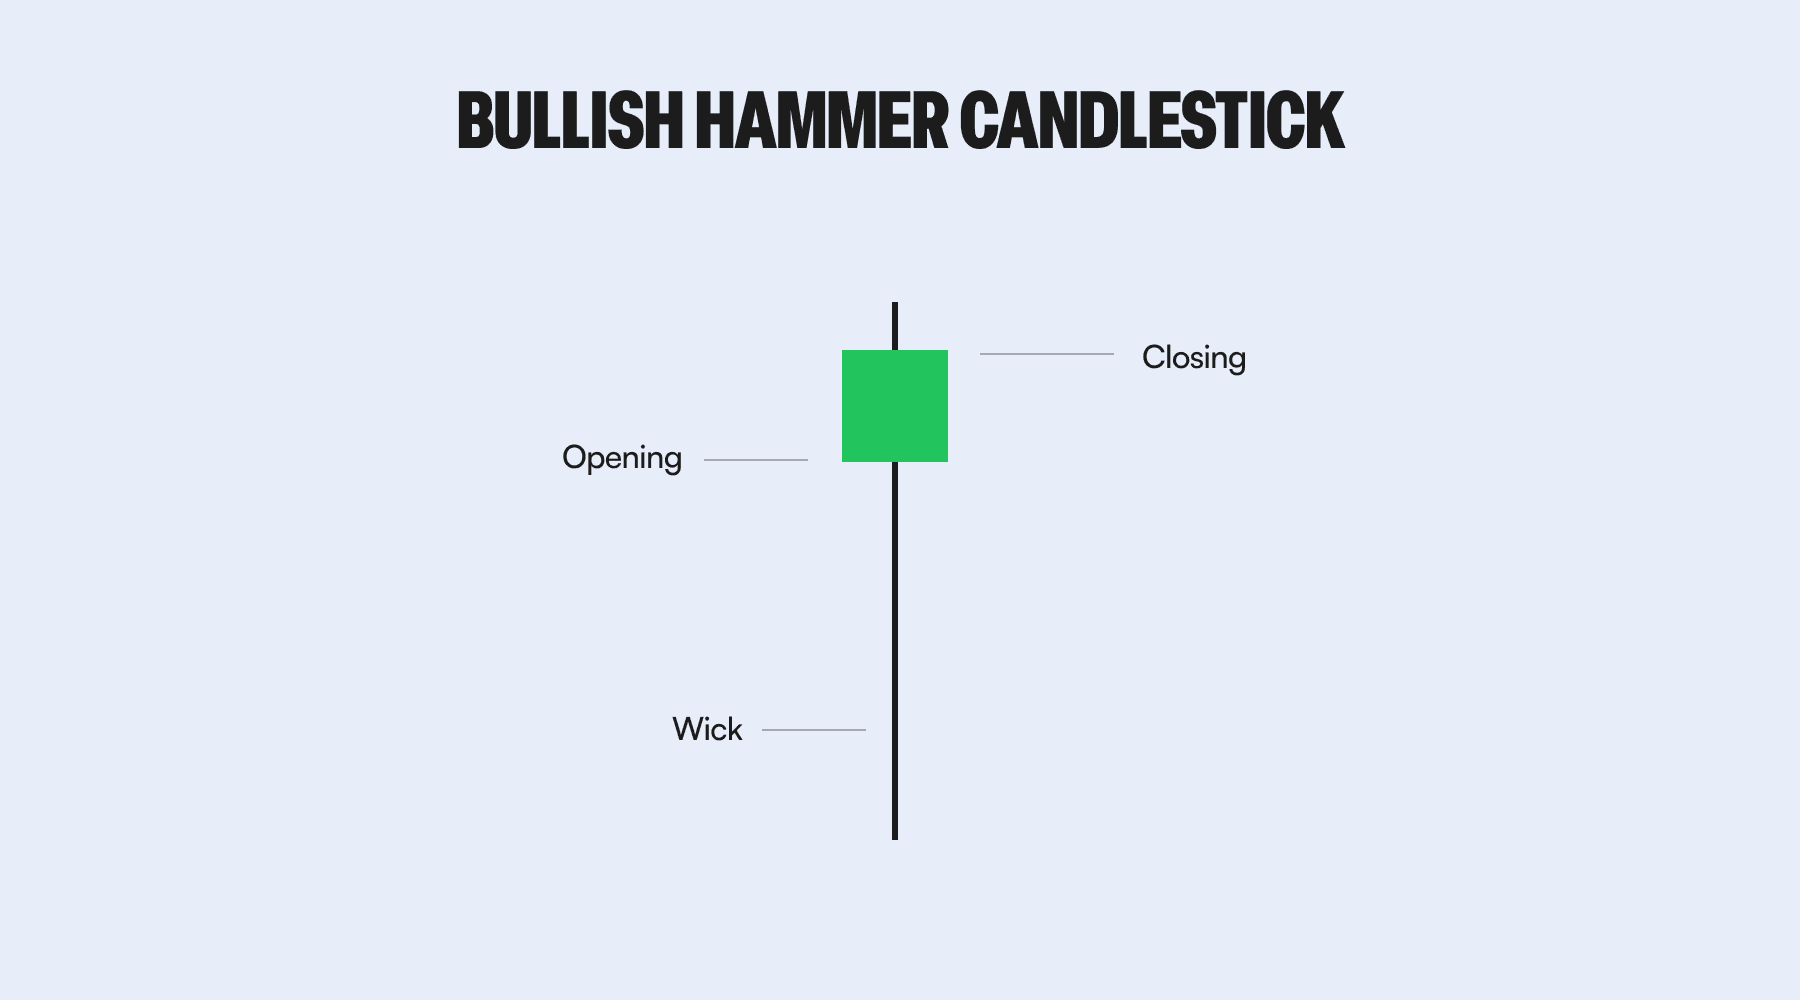
In visual terms:
- Opening and closing prices are close together near the high of the candle.
- The lower shadow is significantly longer than the body.
- The candle appears after a downward price movement, not in the middle of a range.
Examples and Context
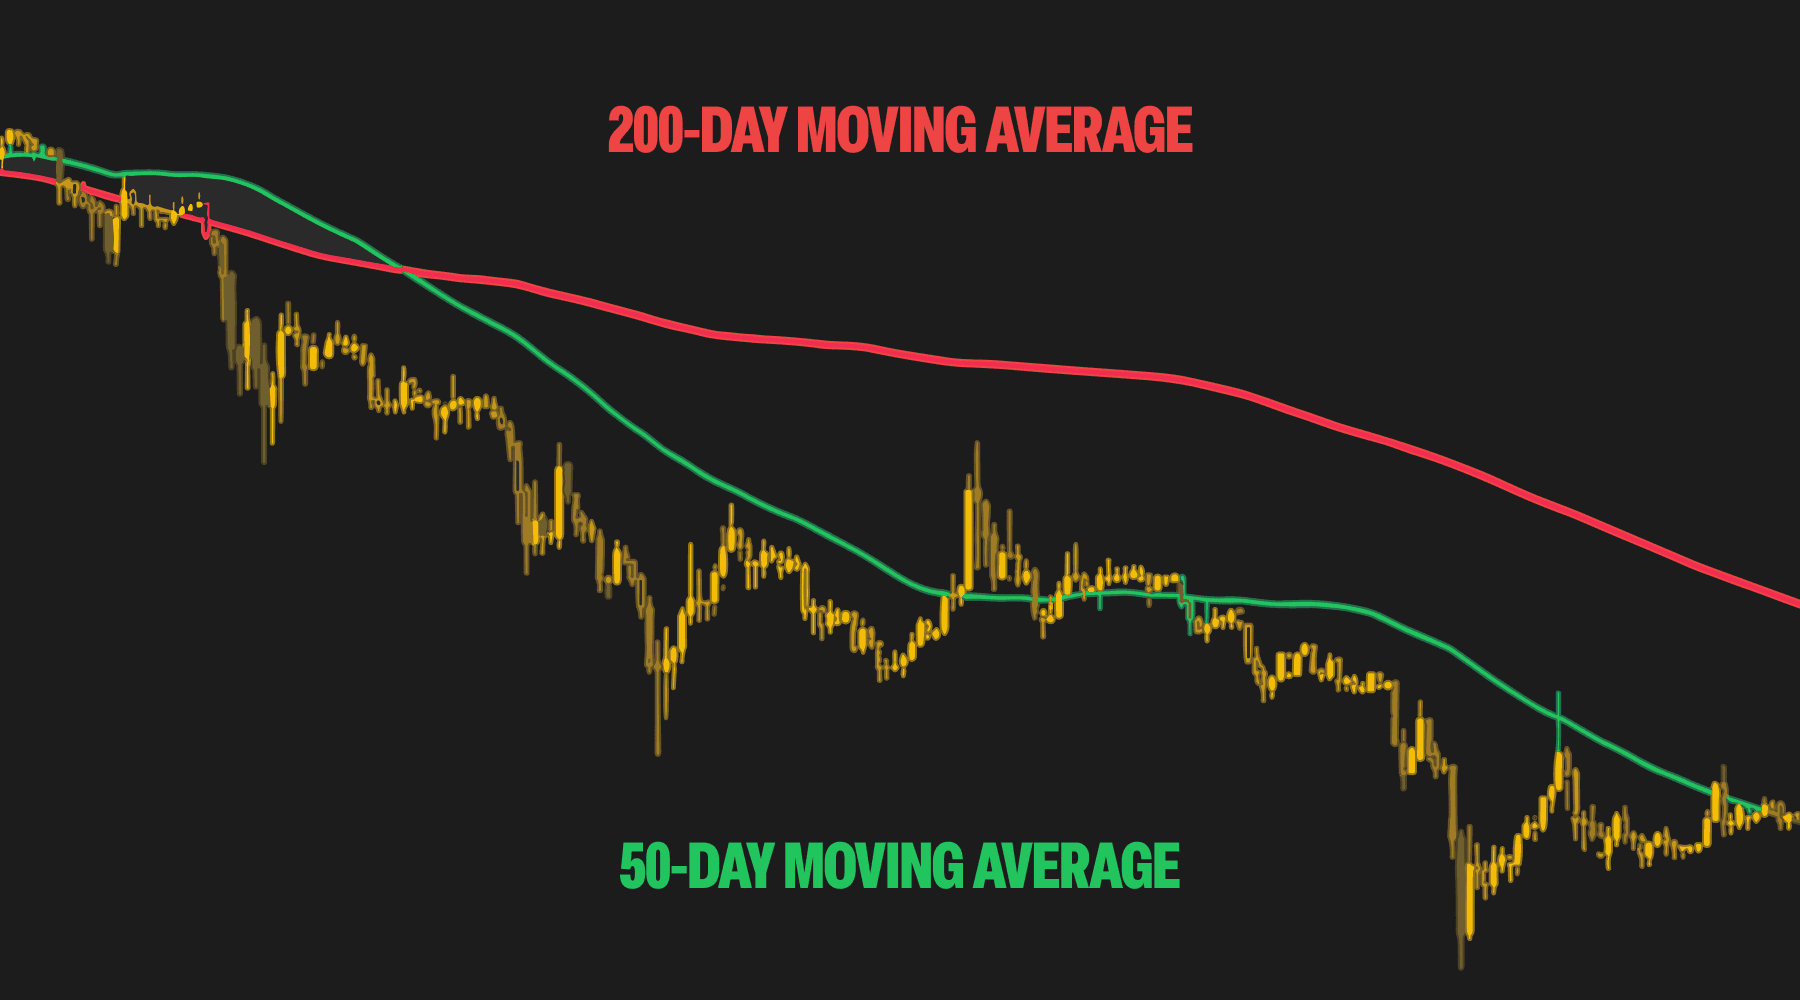
Let’s consider a Bitcoin price chart during a correction. After multiple red candles, price action prints a hammer where the price dipped sharply intraday, touched a support zone, and then rebounded strongly before the close.
Traders may see this as an opportunity to enter a long position, but only after the next candle confirms the pattern by closing higher. Without that confirmation, the reversal may fail.
Tools to Combine With:
- Support zones: If the hammer forms near a known support level, its signal is stronger.
- Volume: High trading volume on the hammer or confirmation candle increases reliability.
- Indicators: Use RSI (e.g., oversold < 30), MACD crossovers, or moving average bounces to validate the setup.
Understanding the context is crucial. A hammer in a sideways market may be meaningless. It must follow a clear downtrend to be valid.
Strengths and Limitations
Strengths:
- Simple to identify
- Appears across all timeframes
- Offers early signal of potential reversals
- Works well when combined with other tools
Limitations:
- Can be mistaken for retracements, not reversals
- False signals common in low-volume or choppy markets
- Requires follow-up confirmation to reduce risk
- Performance varies by asset and market condition
Conclusion
The rising hammer is a powerful but often misunderstood candlestick pattern. It tells the story of bulls fighting back during a downtrend and often marks the beginning of a reversal. For crypto traders, especially those dealing with volatile assets like Bitcoin or Ethereum, the hammer offers a simple yet effective way to identify buy-the-dip scenarios.
But remember: no single candlestick is a crystal ball. To trade the hammer effectively, you need to consider the broader market context, confirm the signal, and always manage risk carefully.
Next Steps
- Learn about the Falling Hammer (Shooting Star), the bearish mirror image of the hammer, in our next article.
- Explore more technical indicators such as RSI, MACD, and moving averages to combine with candlestick signals.
- Practice identifying hammer patterns on a live chart using free tools
By integrating the Rising Hammer pattern into a broader trading strategy that includes confirmation signals and sound risk management, traders can better recognize potential market reversals and make more confident decisions.
Disclaimer
No Investment Advice
The information provided in this article is for educational purposes only and does not constitute investment advice, financial advice, trading advice, or any other type of advice. Bitcoin.com does not recommend or endorse the buying, selling, or holding of any cryptocurrency, token, or financial instrument. You should not rely on the content of this article as a basis for any investment decision. Always do your own research and consult a licensed financial advisor before making any investment decisions.
Accuracy of Information
While we strive to ensure the accuracy and reliability of the information presented, Bitcoin.com makes no guarantees regarding the completeness, timeliness, or accuracy of any content. All information is provided “as is” and is subject to change without notice. You understand that you use any information available here at your own risk.