Trade Bitcoin and other cryptocurrencies with the self-custody Bitcoin.com Wallet app.
The Shooting Star candlestick pattern – sometimes referred to as the Falling Hammer – is a key bearish reversal signal in crypto trading. It forms after an uptrend and warns that buyers are losing control. In this guide, you’ll learn how to identify the pattern, confirm its validity, and use it to anticipate potential market tops with greater confidence.
Disclaimer: This article is for educational purposes only and does not constitute financial advice. Always do your own research before making investment decisions.
Overview of the Falling Hammer Candlestick Pattern
The falling hammer candlestick – more commonly known as the Shooting Star – is a bearish candlestick pattern that appears after a price uptrend. It signals a potential reversal – a point where bullish momentum fades and selling pressure begins to dominate. Traders often use the Shooting Star to exit long positions or prepare for potential short opportunities.
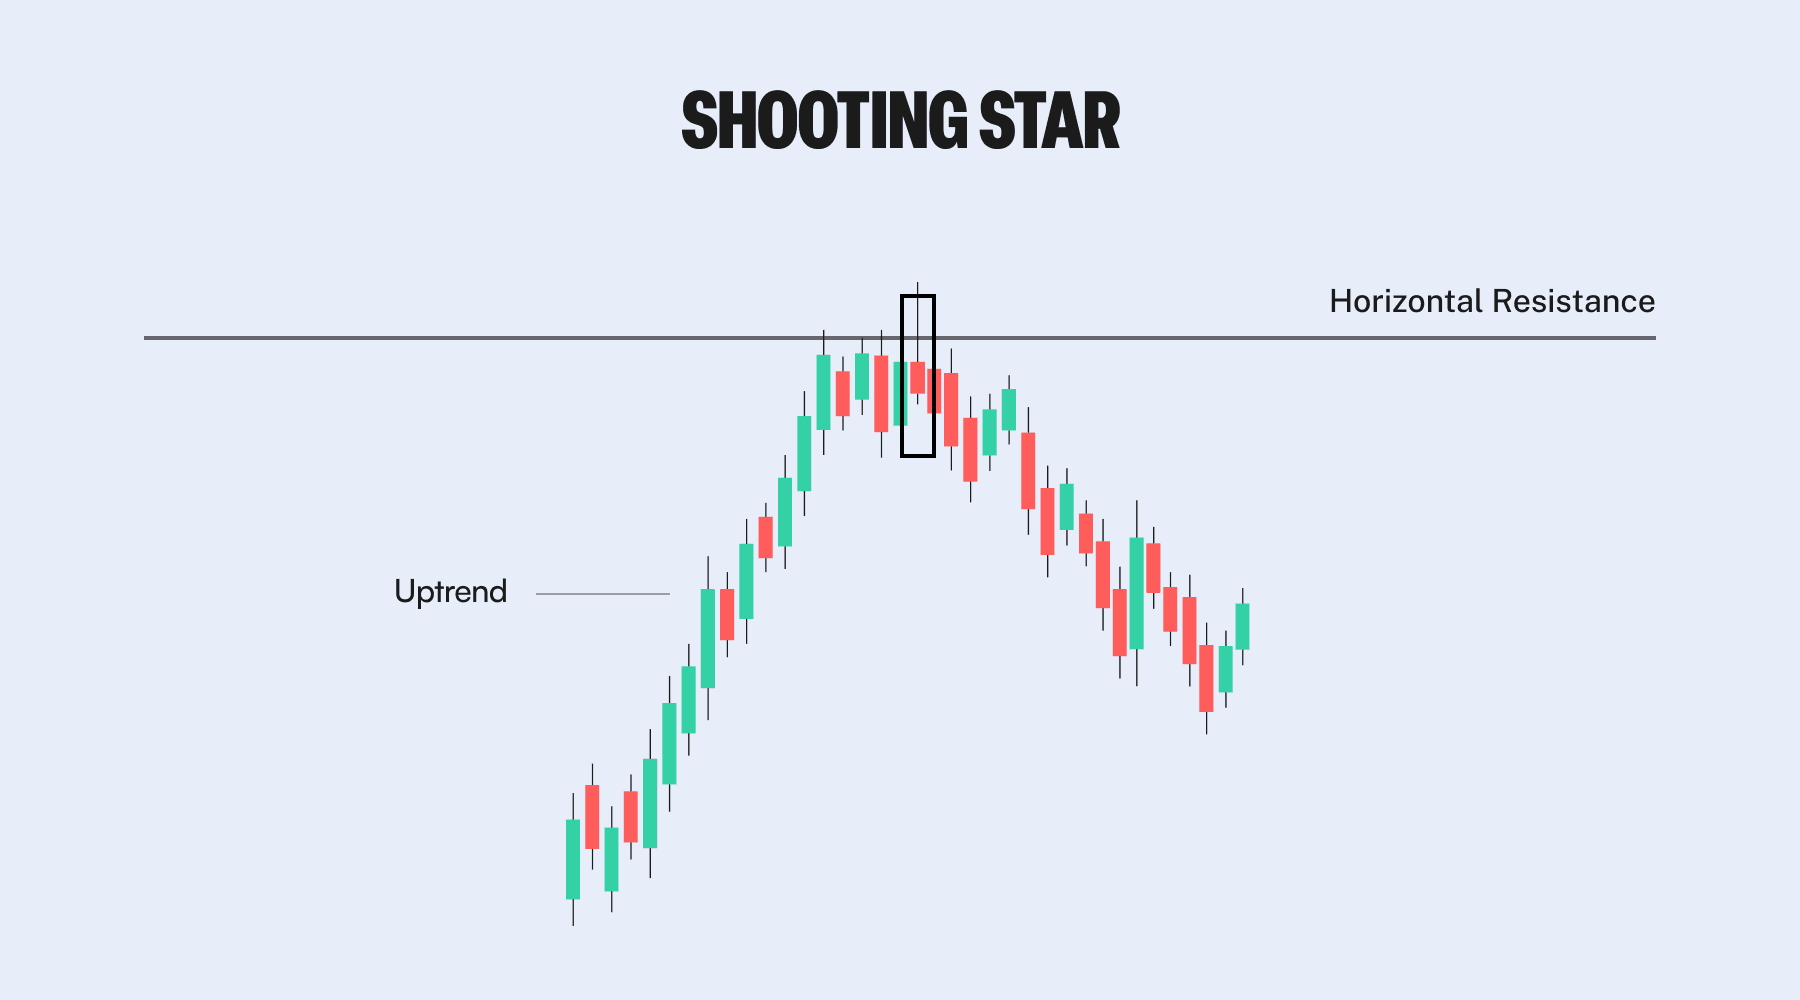
This single-candle pattern is popular among crypto traders for its simplicity and reliability, especially when it forms near known resistance levels or alongside confirmation indicators like volume or trendline breaks.
In this article, we’ll explore what the Shooting Star candlestick pattern is, how to identify it, what it signals about market psychology, and how traders can use it to anticipate bearish reversals more effectively.
What is a Shooting Star Candlestick?
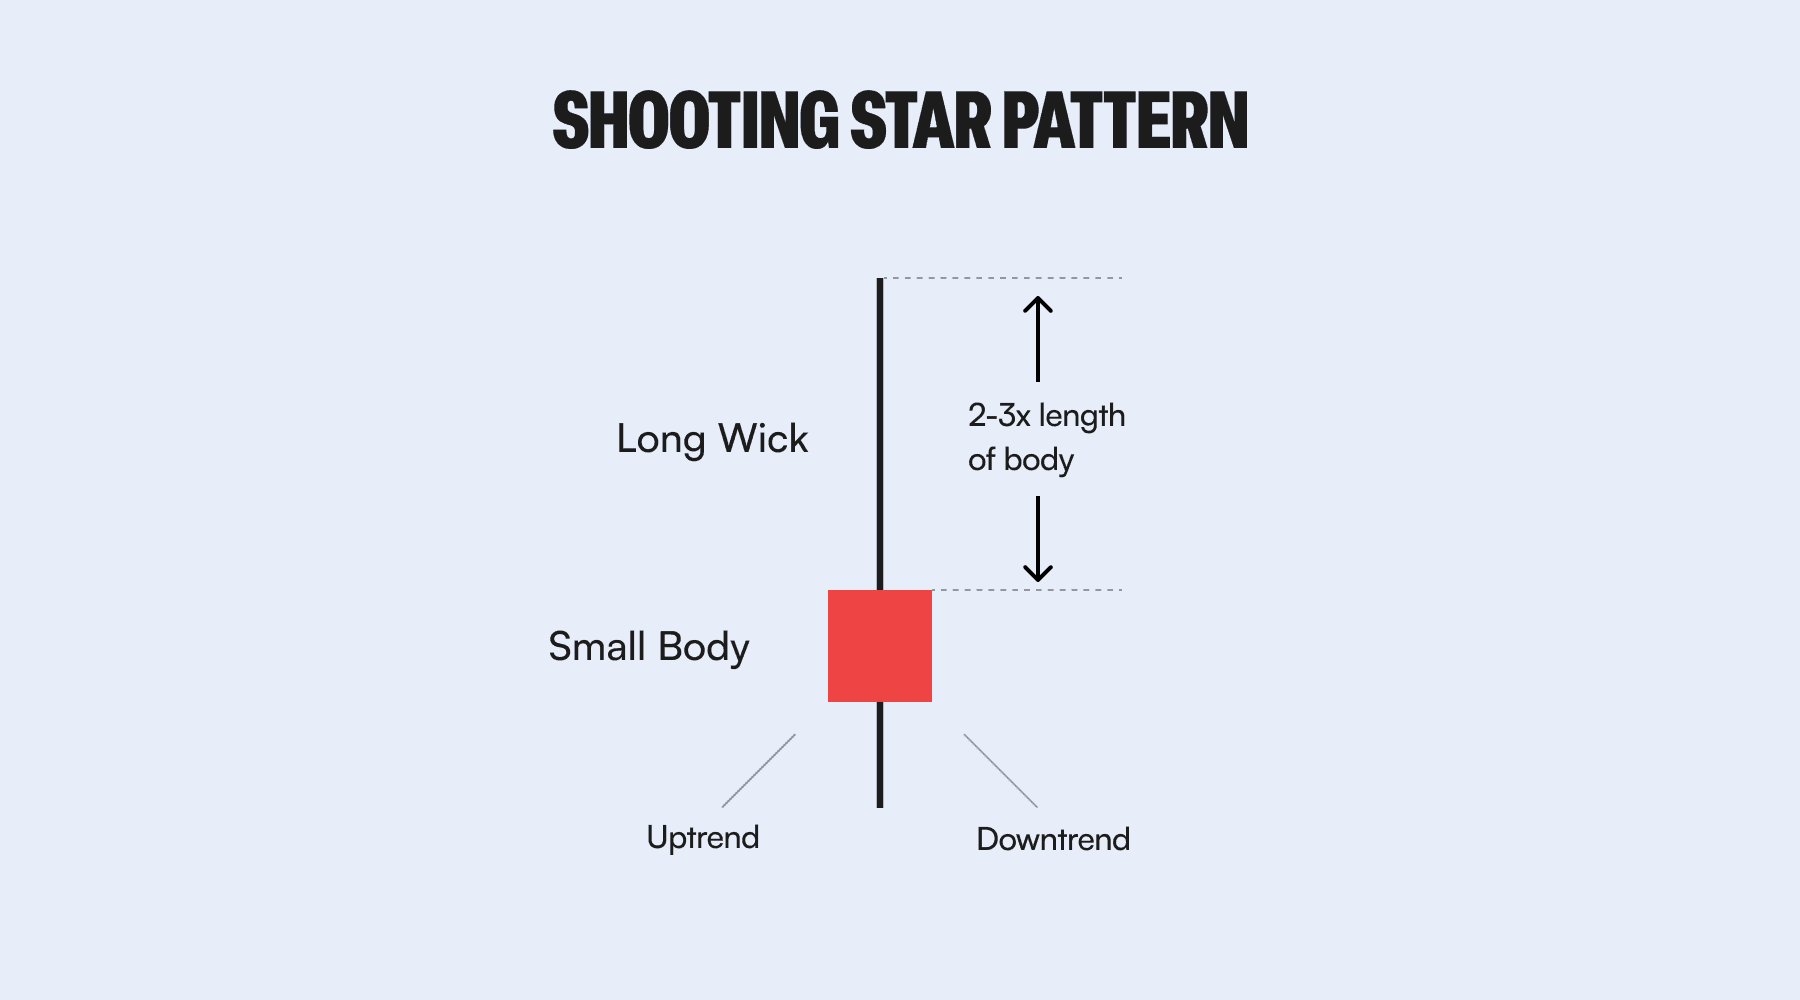
A Shooting Star forms when the market opens, rallies significantly, but then retraces most of its gains to close near the opening price. The result is a small real body at the lower end of the candle and a long upper wick.
This candle tells a clear story: buyers tried to push the price higher, but sellers stepped in and overwhelmed them by the close.
CharacteristicDescriptionTrendMust appear after a strong uptrendUpper wickAt least 2-3 times the size of the bodyReal bodySmall and located near the lowLower shadowVery short or nonexistentCandle colorRed (bearish) preferred, but green is acceptableCharacteristicTrendDescriptionMust appear after a strong uptrendCharacteristicUpper wickDescriptionAt least 2-3 times the size of the bodyCharacteristicReal bodyDescriptionSmall and located near the lowCharacteristicLower shadowDescriptionVery short or nonexistentCharacteristicCandle colorDescriptionRed (bearish) preferred, but green is acceptable
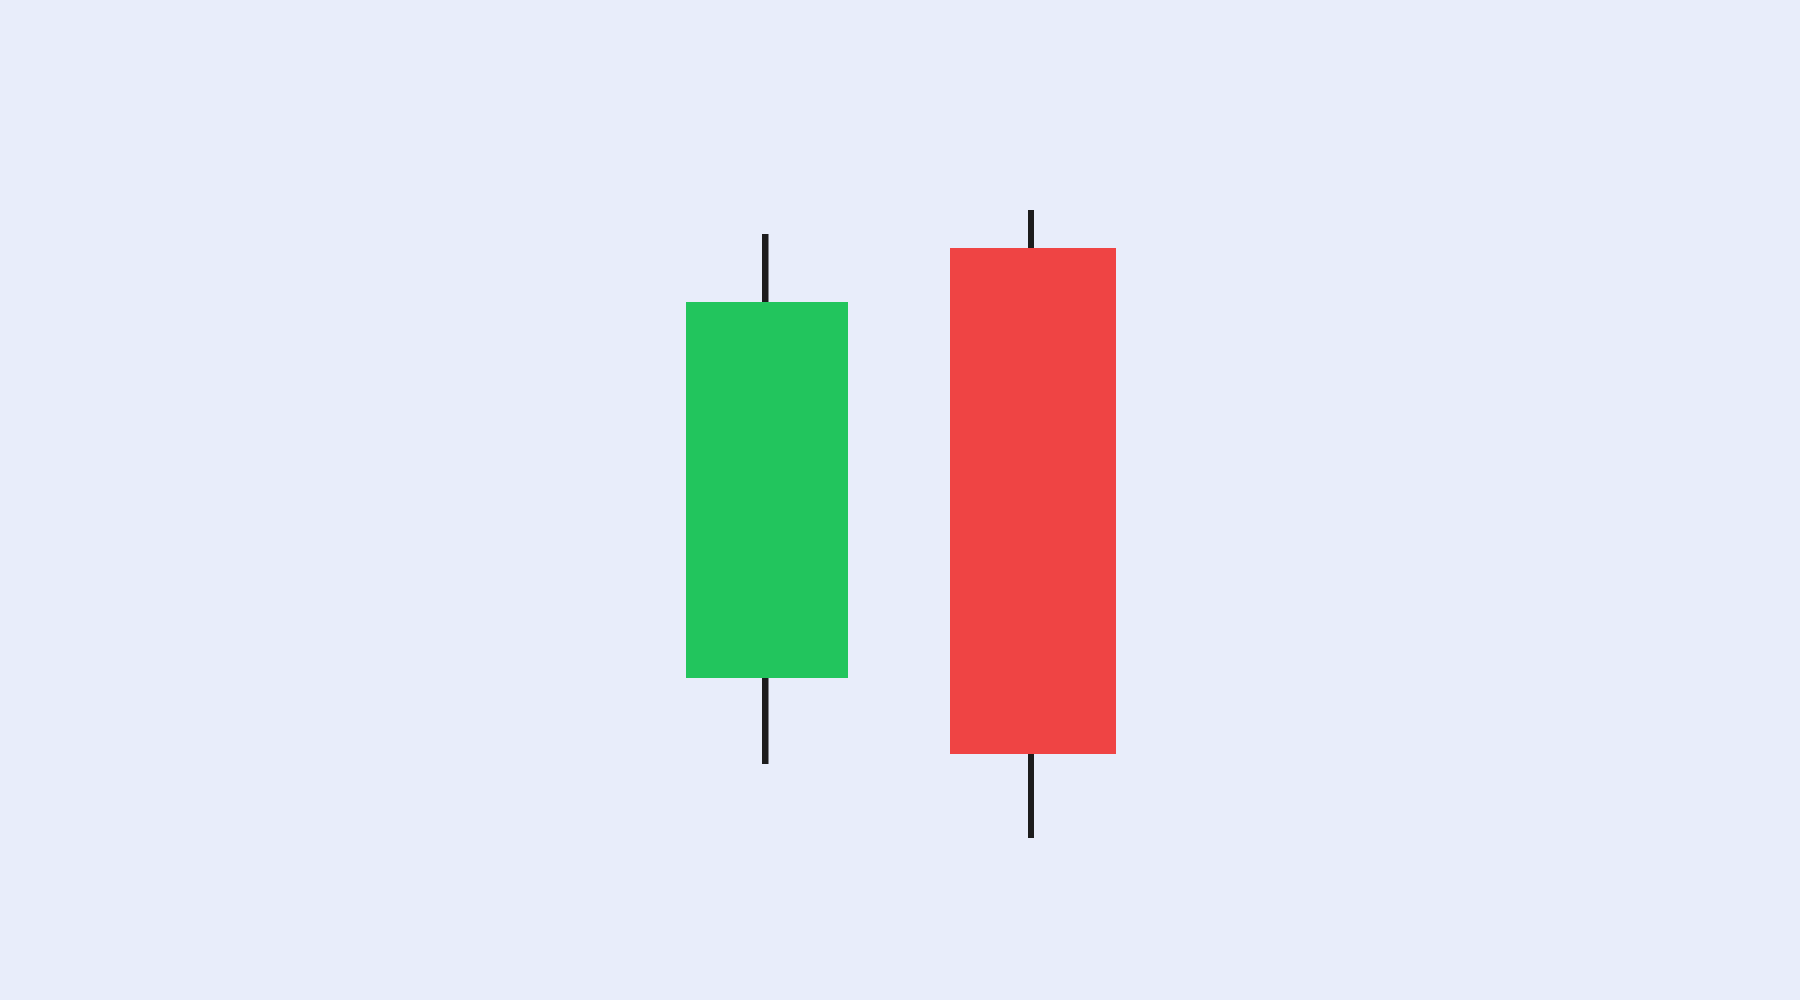
The candle’s body may be red or green, but what matters most is the long upper wick and the location after an uptrend. Without that context, it isn’t a Shooting Star.
The Shooting Star suggests that buyers initially pushed the price higher, but sellers stepped in and drove it back down – indicating potential weakness and a possible bearish reversal.
Psychology Behind the Pattern
The Shooting Star reveals a shift in market sentiment:
- Uptrend in place – Bulls are in control, and prices are rising.
- FOMO kicks in – Late buyers rush in, pushing prices to new highs during the session.
- Rejection – Sellers take advantage of the higher prices and drive the market down.
- Bearish signal – The candle closes near its opening price, leaving a long upper wick – a visual cue of failed bullish momentum.
This formation can trap bullish traders and trigger profit-taking, especially near resistance zones, leading to sharp corrections.
Formula / Identification Criteria
To qualify as a Shooting Star (Falling Hammer), a candlestick must meet the following criteria:
- Upper Shadow ≥ 2 × Body
- Lower Shadow ≈ 0
- Close ≤ Open (red preferred, but green acceptable)
- Trend: Must appear after a clear uptrend
Strengths and Limitations
Strengths:
- Simple to identify and interpret
- Helps spot potential trend reversals at market tops
- Works well when combined with resistance levels, RSI, and volume analysis
Limitations:
- False signals are common without confirmation from the next candle
- Less reliable on low-volume assets with erratic price action
- Short-term timeframes (e.g. 1-minute or 5-minute) often produce noise; higher timeframes are more dependable
- Easily confused with the Inverted Hammer – trend context is essential for correct identification
Conclusion
The Shooting Star is more than just a visually striking candlestick – it’s a clear signal that bullish momentum may be stalling and a potential trend reversal is on the horizon. When it forms after a strong uptrend, especially near a known resistance level or with a confirming drop in price, it can be a powerful tool for identifying exit points or short setups.
But like all candlestick patterns, context is everything.
Don’t trade the Shooting Star in isolation. Instead, treat it as part of a broader system that includes volume, resistance levels, trendlines, and other indicators. Wait for confirmation, define your risk, and plan your trades with discipline.
Mastering this one-candle pattern won’t guarantee profits – but it can help you avoid buying into market tops and sharpen your timing when momentum shifts.
Next Steps
- Learn about the Bullish Engulfing pattern in our next article to deepen your understanding of bearish reversal signals.
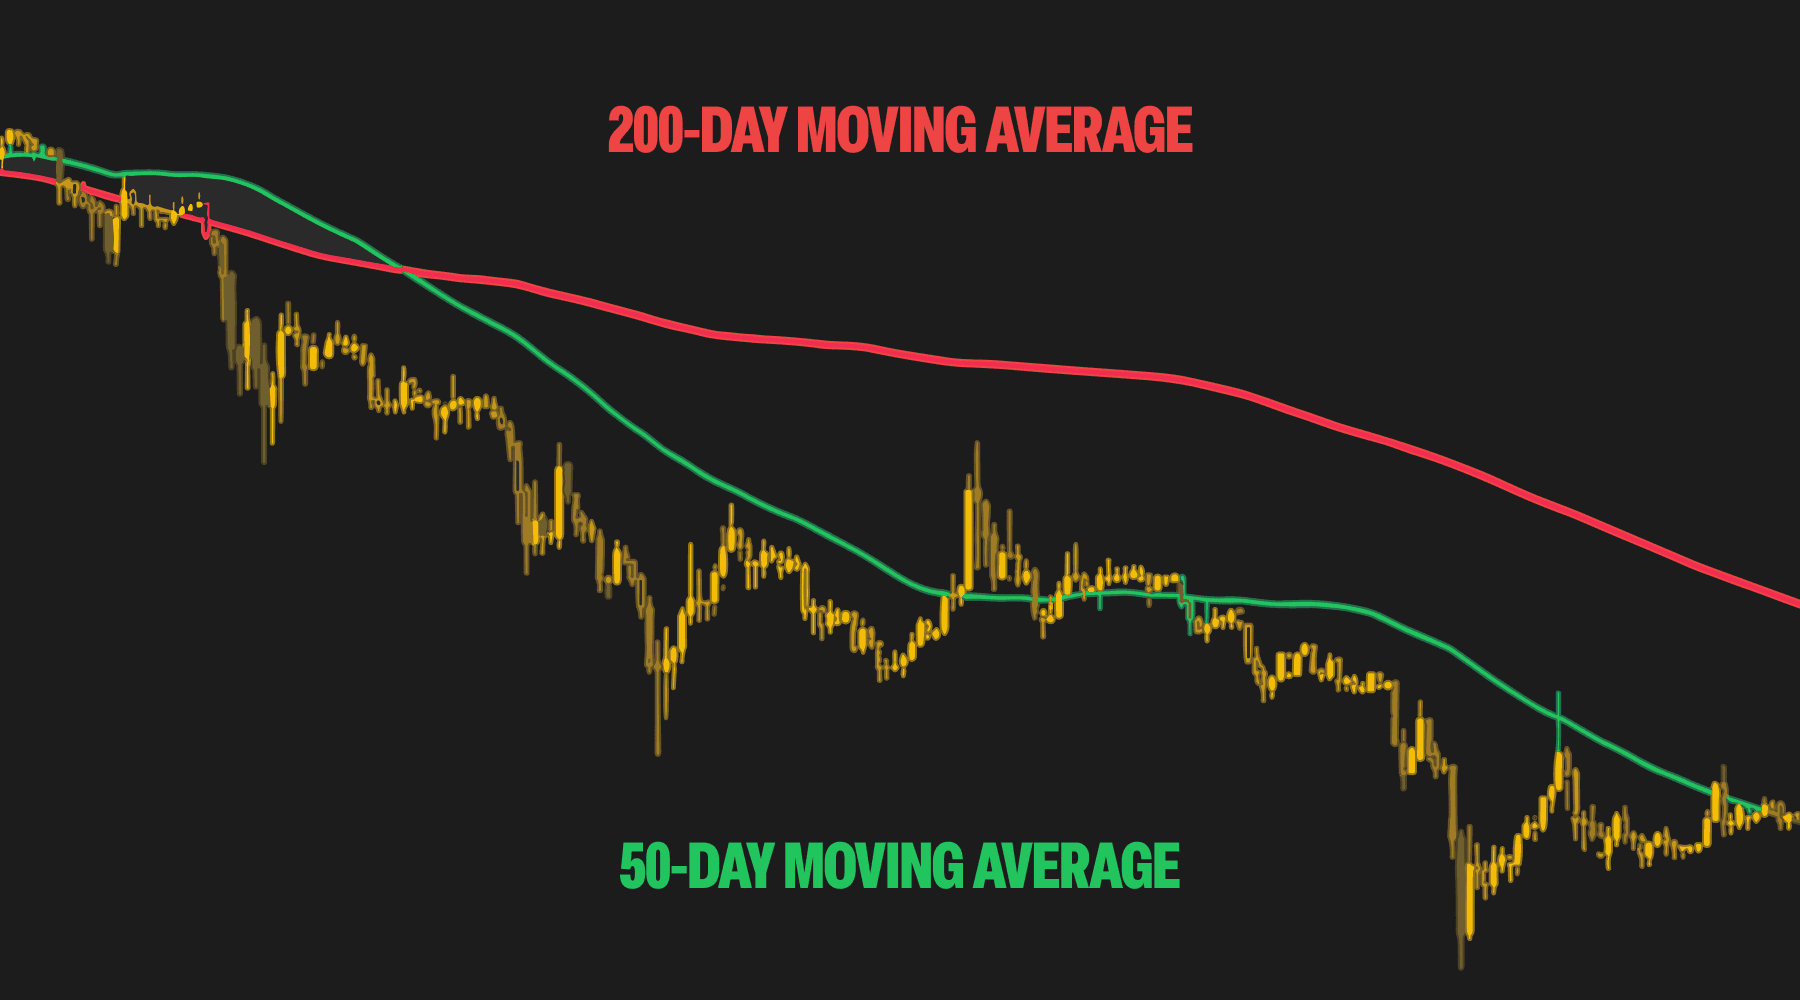
- Explore more technical indicators such as RSI, MACD, and moving averages to combine with candlestick patterns for stronger confirmation.
- Practice identifying Shooting Star patterns on real charts using free tools or your preferred exchange platform.
By integrating the Falling Hammer pattern into a broader trading strategy that includes confirmation signals and risk controls, traders can more effectively anticipate potential trend reversals from bullish to bearish and make more confident decisions.