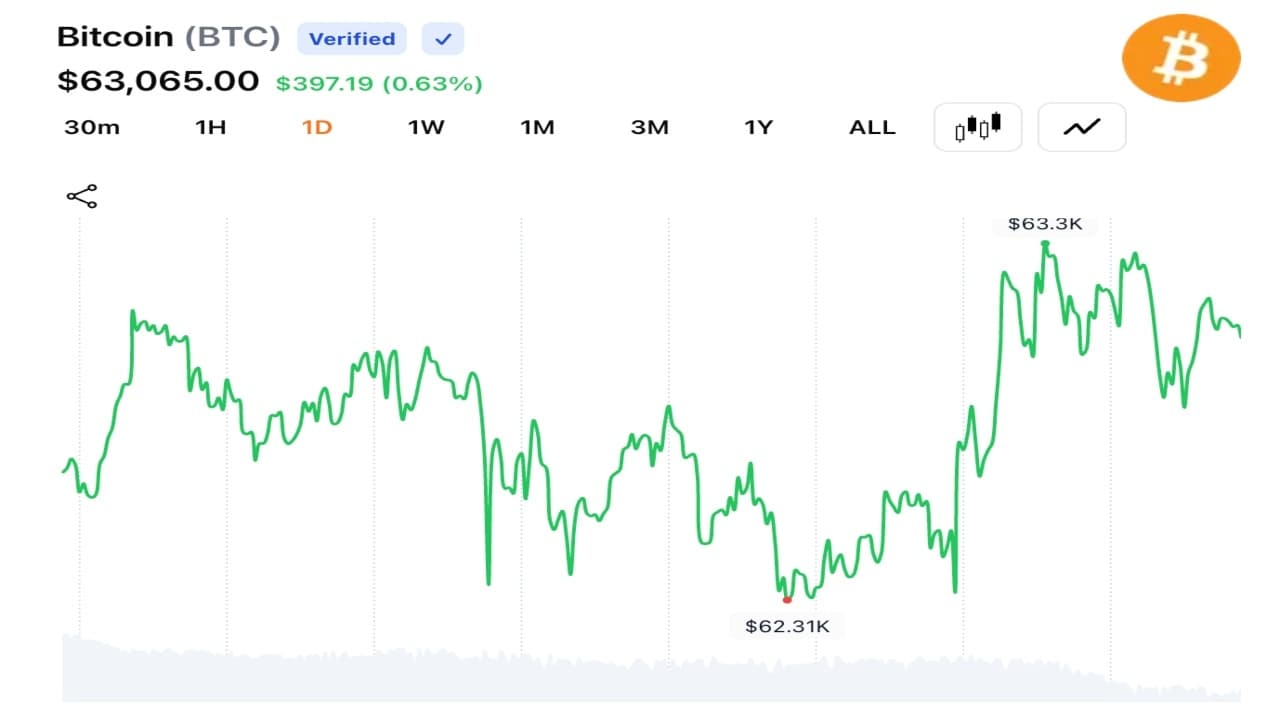
Intraday Recovery Holds Above $62K
The 24-hour gain brought bitcoin’s price to approximately $62,780 at the time of analysis, with a market capitalization near $1.258 trillion and 24-hour trading volume of $29.66 billion.
The intraday low of $60,914 served as the session’s key test, with buyers defending the level and pushing the price back toward the $62,800–$63,200 range before consolidation. The recovery follows a month in which bitcoin has declined 22.85% and sits 27.93% below its year-to-date opening level.
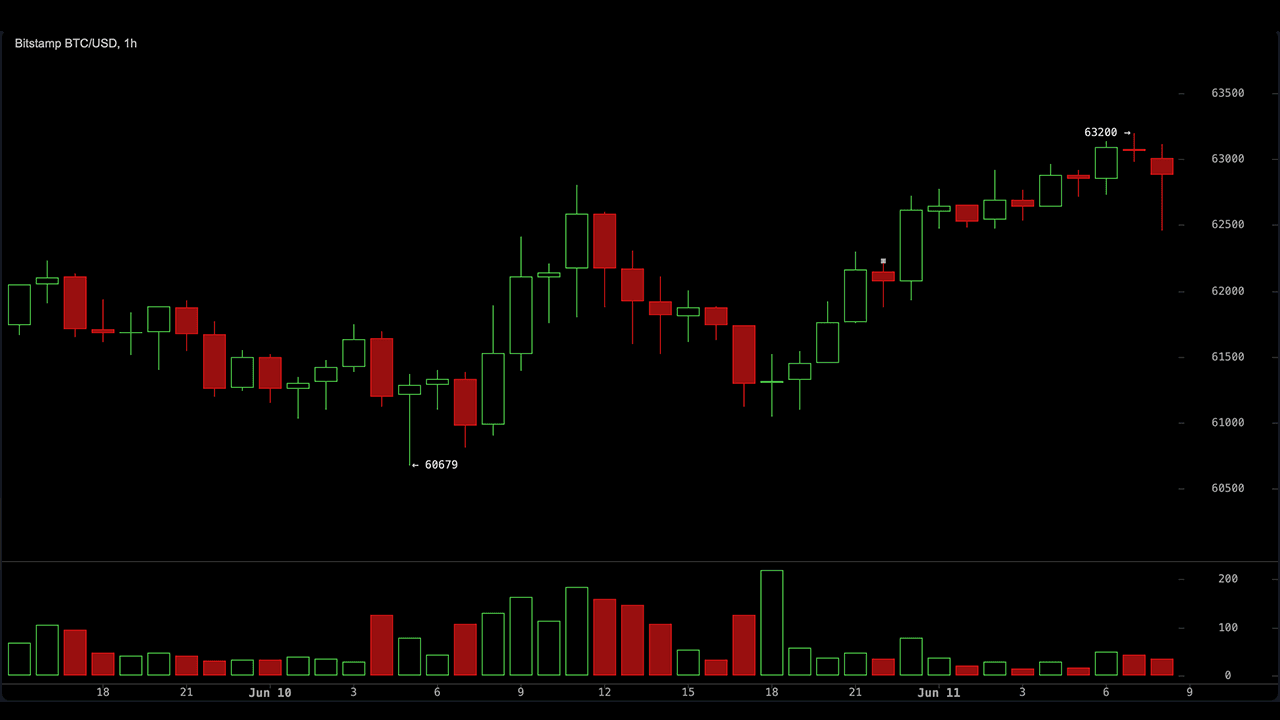
1-Hour Chart: Higher Highs, Higher Lows in Place
The 1-hour chart shows the clearest structure of the three timeframes analyzed. Price formed a series of higher highs and higher lows after establishing a low near $60,700, with buyers controlling intraday momentum throughout the session.

An aggressive long entry setup calls for a pullback into the $62,200–$62,500 zone with bullish candle confirmation, targeting $63,500, $64,000, and $65,000. A breakout entry above $63,300–$63,500 on an hourly close targets $64,500, $65,000, and $66,000, with the setup invalidated on a move back below $62,800. Risk for the aggressive setup sits below $61,800.
4-Hour Chart: Buyers Defend $61K, Resistance Looms at $63.5K
The 4-hour chart shows a short-term bullish recovery structure taking shape after the $59,100 washout that defined the recent low. Higher lows have formed across multiple sessions, with buyers defending the $61,000 area repeatedly and price reclaiming the $62,000 level.

The key test on this timeframe is a break and hold above $63,500–$64,000, which opens targets at $65,000, $66,000, and $68,000. A rejection near $64,000 followed by a loss of $61,500 would reopen the path toward $60,000 and a retest of the $59,100 critical support. Probability weighting from the multi-timeframe analysis puts consolidation between $61,000–$64,000 at 45%, a breakout toward $66,000 at 35%, and a retest of $60,000 at 20%.
Daily Chart: Bearish Structure Intact, Relief Rally Underway
The daily bitcoin chart places the current recovery in a broader corrective context. Bitcoin sold off from approximately $82,800 to the $59,100 low with volume expanding during the decline, confirming distribution at higher levels. Recent candles show stabilization in the $60,000–$63,000 range, but the series of lower highs on the daily chart remains unbroken.

The daily trend is considered bearish until bitcoin closes above the $66,000–$68,000 region. Major resistance sits at $68,000–$72,000. The current move reads as a relief rally within a corrective phase, not a confirmed trend reversal. Bitcoin also touched its 200-week moving average during this period, a level that has historically preceded significant mean-reversion reactions.
Oscillators: RSI at 30, Momentum Turns Bullish
Oscillator readings at the time of analysis showed a predominantly neutral picture with selective bullish signals on the most oversold metrics. The relative strength index ( RSI) registered 30, a positive signal, and the lowest RSI reading recorded since November 2018. The Stochastic sat at 18, neutral.
The commodity channel index (CCI) printed at negative 74, neutral. The average directional index (ADX) read 47, neutral, indicating trend strength without direction bias. The Awesome oscillator came in at negative 10,719, neutral. Momentum registered negative 8,547, a positive signal. Meanwhile, the moving average convergence divergence ( MACD) level printed at negative 4,047, the sole bearish signal among the oscillators. The overall oscillator summary: 8 neutral, 2 bullish, 1 bearish.
Moving Averages: 13 of 15 Signal Sell
The moving average (MA) tape presents the bearish case more clearly. Thirteen of 15 tracked averages issued negative signals as bitcoin traded below every major exponential moving average (EMA) and simple moving average (SMA) except the SMA (10) at $62,861, which returned a neutral read, and the SMA (10) area near the current price. The EMA (10) stood at $64,046, which is slightly bearish. The EMA (20) sat at $67,402, also slightly bearish. The SMA (20) printed at $68,760, which is negative too.
The EMA (30) read $69,567, bearish. The SMA (30) was at $71,811, bearish. The EMA (50) sat at $71,624, bearish. The SMA (50) was at $74,702, bearish. The EMA (100) came in at $73,967, bearish. The SMA (100) printed $72,810, negative. The EMA (200) sat at $79,230, negative. The SMA (200) was at $78,007, negative. The overall technical summary across all indicators: 14 negative signs, 9 neutral, and 3 bullish signals. Bitcoin’s all-time high remains $126,272, with a circulating supply of 20.04 million BTC.
Bull Verdict:
Bitcoin’s RSI at 30 marks the most oversold reading since November 2018, a level that has historically preceded significant recoveries. The 1-hour chart structure is clean: higher highs, higher lows, and rising momentum off the $60,700 low. Buyers defended $61,000 repeatedly on the 4-hour chart, and the momentum indicator has flipped to a bullish signal. Price also touched the 200-week moving average, a historically significant support level. A 4-hour close above $63,500–$64,000 opens a clear path toward $65,000–$66,000 with defined risk below $61,800.
Bear Verdict:
Thirteen of 15 moving averages issue negative signals, and bitcoin sits below every major EMA and SMA from the EMA (10) at $64,046 all the way through the EMA (200) at $79,230. The moving average convergence divergence ( MACD) level prints negative 4,047. The daily chart shows a confirmed series of lower highs with no break above the $66,000–$68,000 zone required to flip the trend. Bitcoin is down 22.85% over the past month and 27.93% year-to-date. The current bounce reads as a relief rally within a bearish structure. Until price reclaims and holds above $68,000, every rally into resistance is a potential short.