In economics, one person’s spending is another person’s income. That single sentence is the foundation of almost everything that happens in a modern economy. Add credit to that equation (let people spend money they don’t yet have, in exchange for spending less later) and you get cycles. Not random ups and downs, but a structured rhythm of expansion and contraction that plays out across both years and generations.
Long-term productivity grows roughly in a straight line. Inventions accumulate; people learn to do more with less; output rises. But the economy swings around that productivity line because of debt. When we borrow, we pull future consumption forward. When we pay it back, we push current consumption down. Multiply that across billions of borrowers and dozens of countries, and you get debt cycles: short ones lasting roughly a decade, long ones spanning a lifetime.
A note on terminology: in macroeconomics, “credit cycle” and “debt cycle” describe the same phenomenon from two different sides. Lenders extend credit; borrowers take on debt. Same flows, different labels.
This article covers the short-term and long-term debt cycles, the anatomy of a debt crisis, the four ways an economy can deleverage, Irving Fisher’s debt-deflation theory, and a candid look at where the United States actually sits today. Buckle up, we’re in for a wild ride.
What Is a Debt Cycle? Short-Term vs. Long-Term
The core engine of any debt cycle is the price of money: interest rates. Central banks set short-term rates; those rates ripple through credit markets and determine how aggressively households, businesses, and governments borrow. Cheap credit fuels expansion. Expensive credit forces contraction.
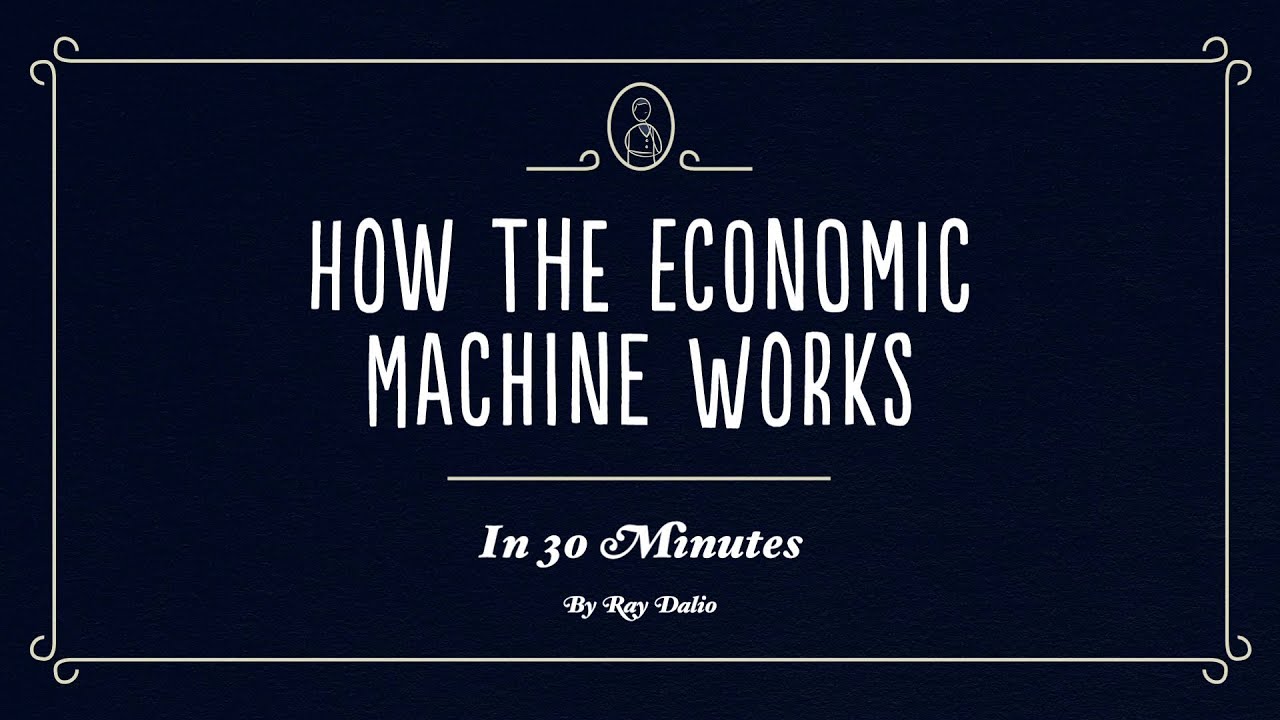
Where it gets interesting is that this same machinery runs at two speeds simultaneously. Ray Dalio, founder of Bridgewater Associates, popularized a framework for this dual-cycle dynamic in his book Principles for Navigating Big Debt Crises and his widely-shared video How the Economic Machine Works. His framework is now the lingua franca of macro-investing conversations about debt.
The short-term debt cycle (the business cycle)
This is what most people think of as “the economy.” It lasts roughly 5 to 8 years and is driven almost entirely by central bank interest rate decisions.
The cycle expands when rates are low and credit is cheap: people borrow, spend, invest => asset prices rise => employment grows.
FeatureShort-Term Debt CycleLong-Term Debt CycleDuration5 to 8 years50 to 75 yearsAlso known asBusiness cycle / credit cycleSecular debt cyclePrimary driverCentral bank interest rate adjustmentsStructural accumulation of debt across cyclesEnding triggerMild recession, fixable by rate cutsSystemic debt crisis (rates already near zero)ResolutionLower interest rates, restart creditDeleveraging (austerity, defaults, wealth transfer, money printing)FrequencyMultiple per lifetimeRoughly one per lifetimeFeatureDurationShort-Term Debt Cycle5 to 8 yearsLong-Term Debt Cycle50 to 75 yearsFeatureAlso known asShort-Term Debt CycleBusiness cycle / credit cycleLong-Term Debt CycleSecular debt cycleFeaturePrimary driverShort-Term Debt CycleCentral bank interest rate adjustmentsLong-Term Debt CycleStructural accumulation of debt across cyclesFeatureEnding triggerShort-Term Debt CycleMild recession, fixable by rate cutsLong-Term Debt CycleSystemic debt crisis (rates already near zero)FeatureResolutionShort-Term Debt CycleLower interest rates, restart creditLong-Term Debt CycleDeleveraging (austerity, defaults, wealth transfer, money printing)FeatureFrequencyShort-Term Debt CycleMultiple per lifetimeLong-Term Debt CycleRoughly one per lifetime
Inflation eventually picks up, the central bank tightens, credit contracts, and the economy slows or enters a recession. The central bank then cuts rates, credit becomes cheap again, and the next cycle begins.
This is the cycle financial markets watch on a quarterly basis. It’s also the cycle the Federal Reserve and other central banks are designed to manage.
The long-term debt cycle (the secular cycle)
This one is harder to see because most people only live through one and a half of them. It lasts roughly 50 to 75 years and is the accumulated residue of dozens of short-term cycles. The mechanic is straightforward but consequential. At the bottom of each short-term cycle, the central bank cuts rates to stimulate borrowing.
To pull the economy out of each successive trough, rates have to be cut a little further, and debt is left a little higher than at the start of the previous cycle. Over decades, debt-to-income ratios climb and interest rates trend down.
Eventually two things converge: debt is unprecedented as a share of the economy, and policy rates have hit zero (the “zero lower bound”). At that point, the standard playbook stops working.
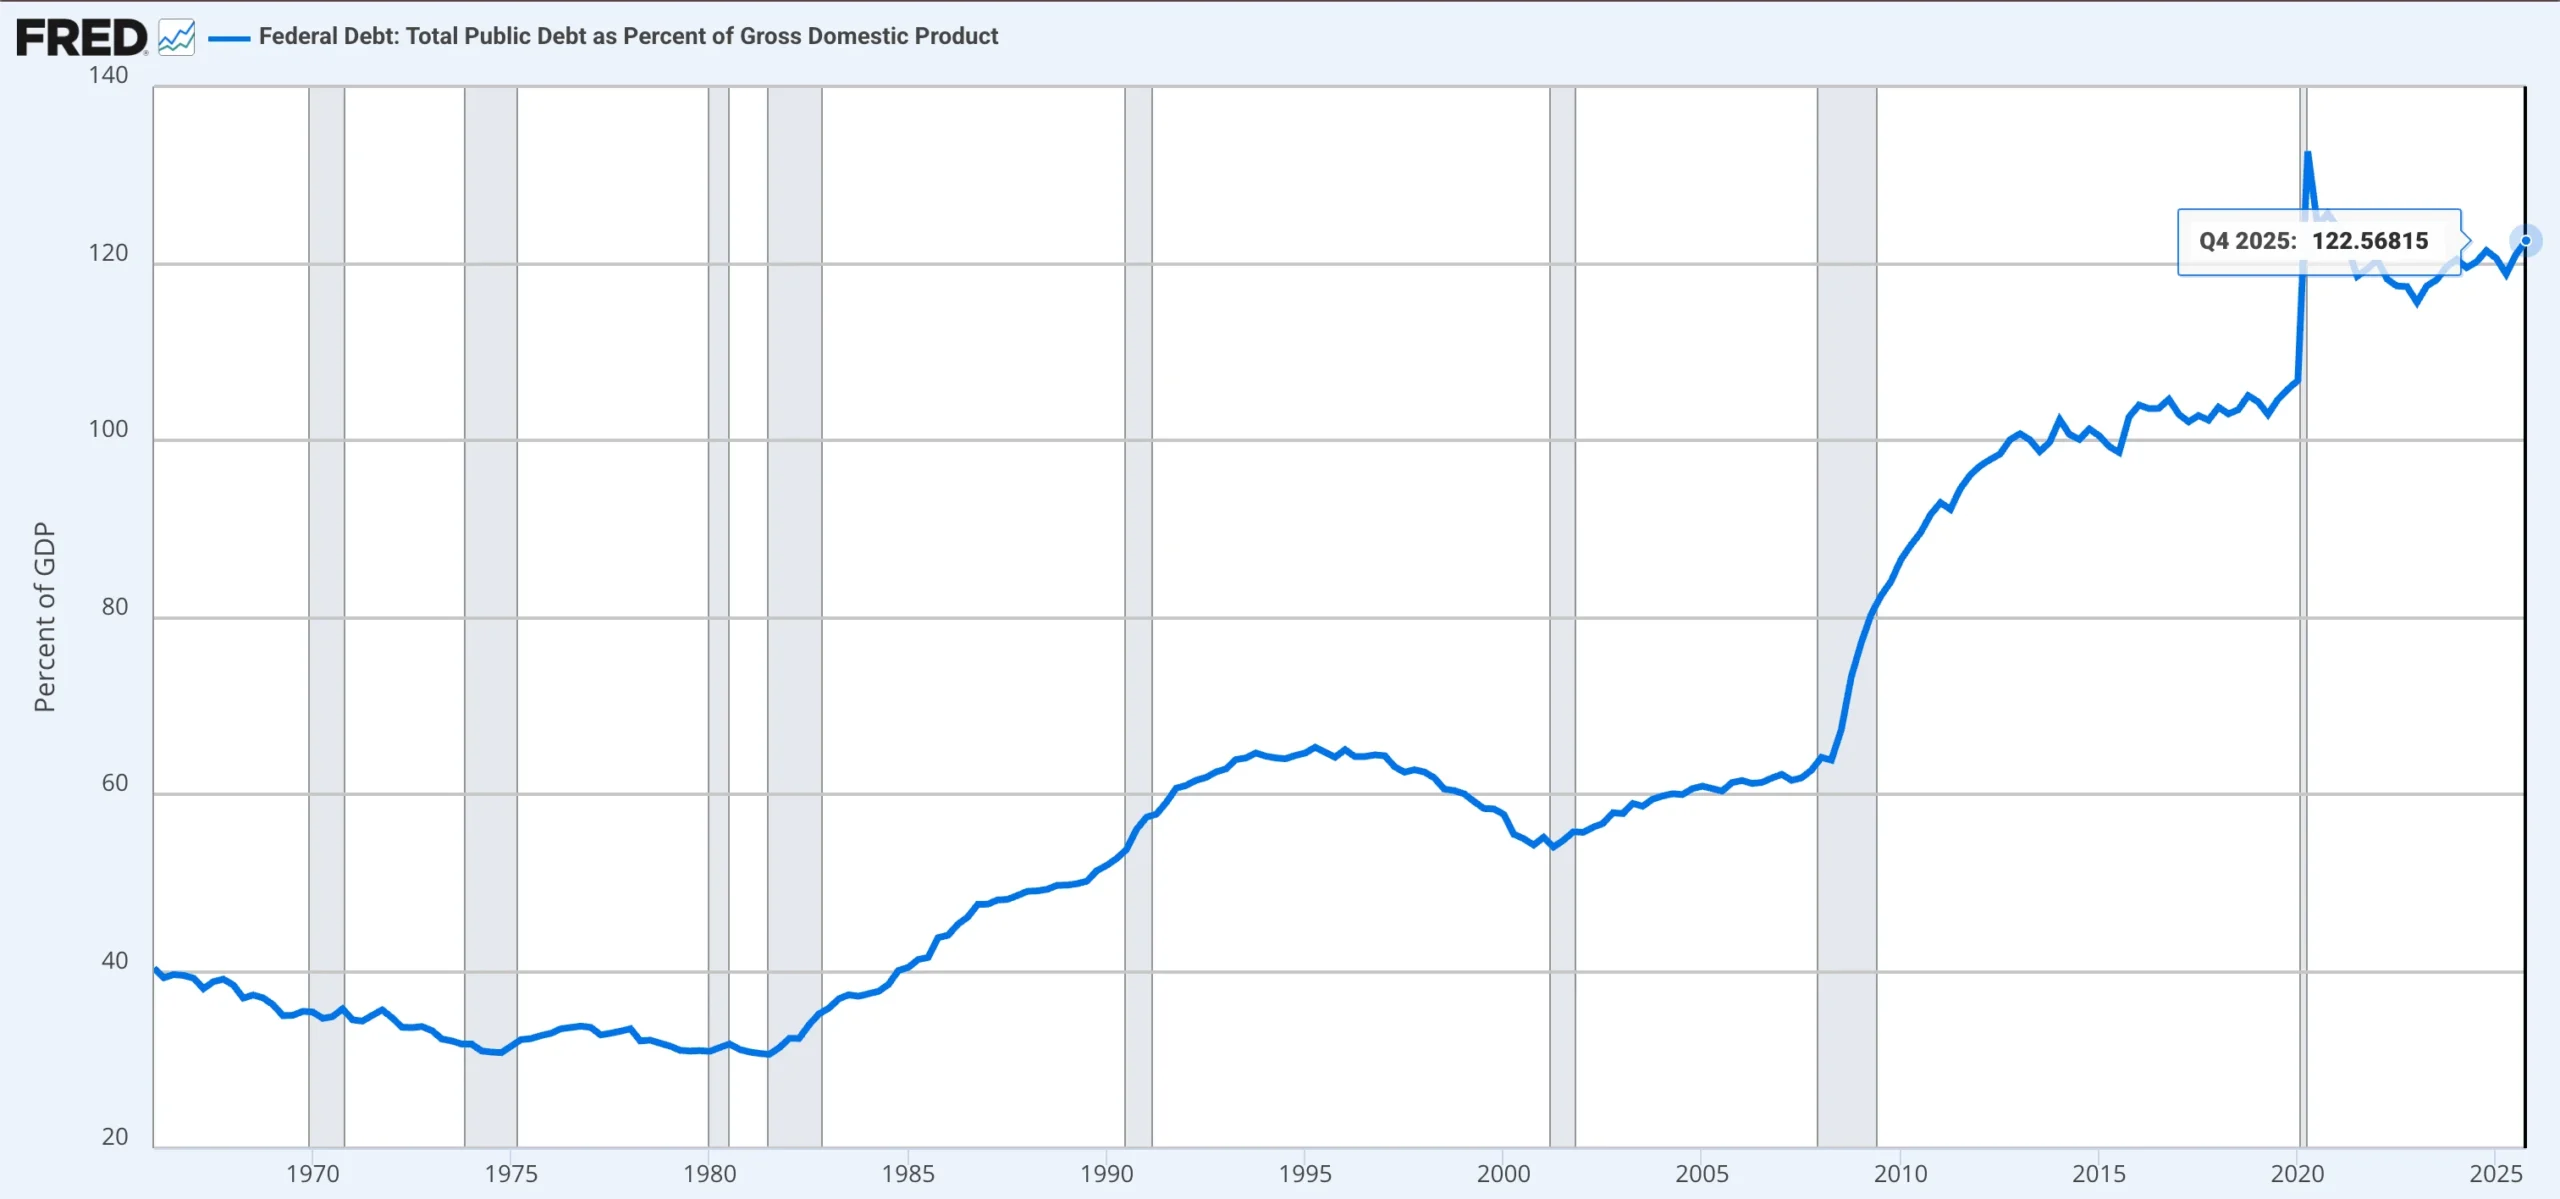 US Federal Debt-to-GDP Ratio
The Federal Reserve’s policy rate hit effectively zero in late 2008 and stayed there for seven years, then again in 2020. The current short-term cycle (the one that began with rate cuts in late 2024) is layered on top of a long-term cycle that’s now visibly mature.
Gross federal debt has been above 100% of GDP continuously since late 2012, spiked to roughly 133% during the 2020 pandemic response, and currently sits at approximately 123% of GDP.
That’s well above the previous post-WWII high of around 106% set in 1946. Interest costs totaled $970 billion in fiscal year 2025 and are projected by the CBO to cross $1 trillion in fiscal year 2026. This is an all-time high in dollar terms and, at roughly 3.3% of GDP, also a post-WWII high as a share of the economy.
The Phases of a Debt Crisis
When a long-term debt cycle reaches its final stages, it produces what Dalio calls a “big debt crisis.” Every one of them (1929, 1989 Japan, 2008, the European sovereign crisis) follows roughly the same anatomy.
Phase 1: The bubble
Debt grows faster than income, but it doesn’t feel dangerous. Asset prices (stocks, real estate, sometimes crypto) are rising, so borrowers feel wealthier than they are. Lenders, seeing rising collateral values, drop their standards: looser covenants, lower down payments, higher loan-to-value ratios. Optimism becomes self-reinforcing. The 1920s, the late-1980s Japanese real estate market, the mid-2000s US housing market, and the late 2010s leveraged corporate-credit boom all share this shape.
Phase 2: The top
The debt-service burden, interest plus principal payments, eventually grows large enough that further borrowing slows. One way economists track this pressure is through the Household Debt Service Ratio, which measures required debt payments as a percentage of disposable income.
Rising readings suggest households are devoting more income to servicing debt and less to consumption, increasing the risk that the credit cycle is approaching a turning point.
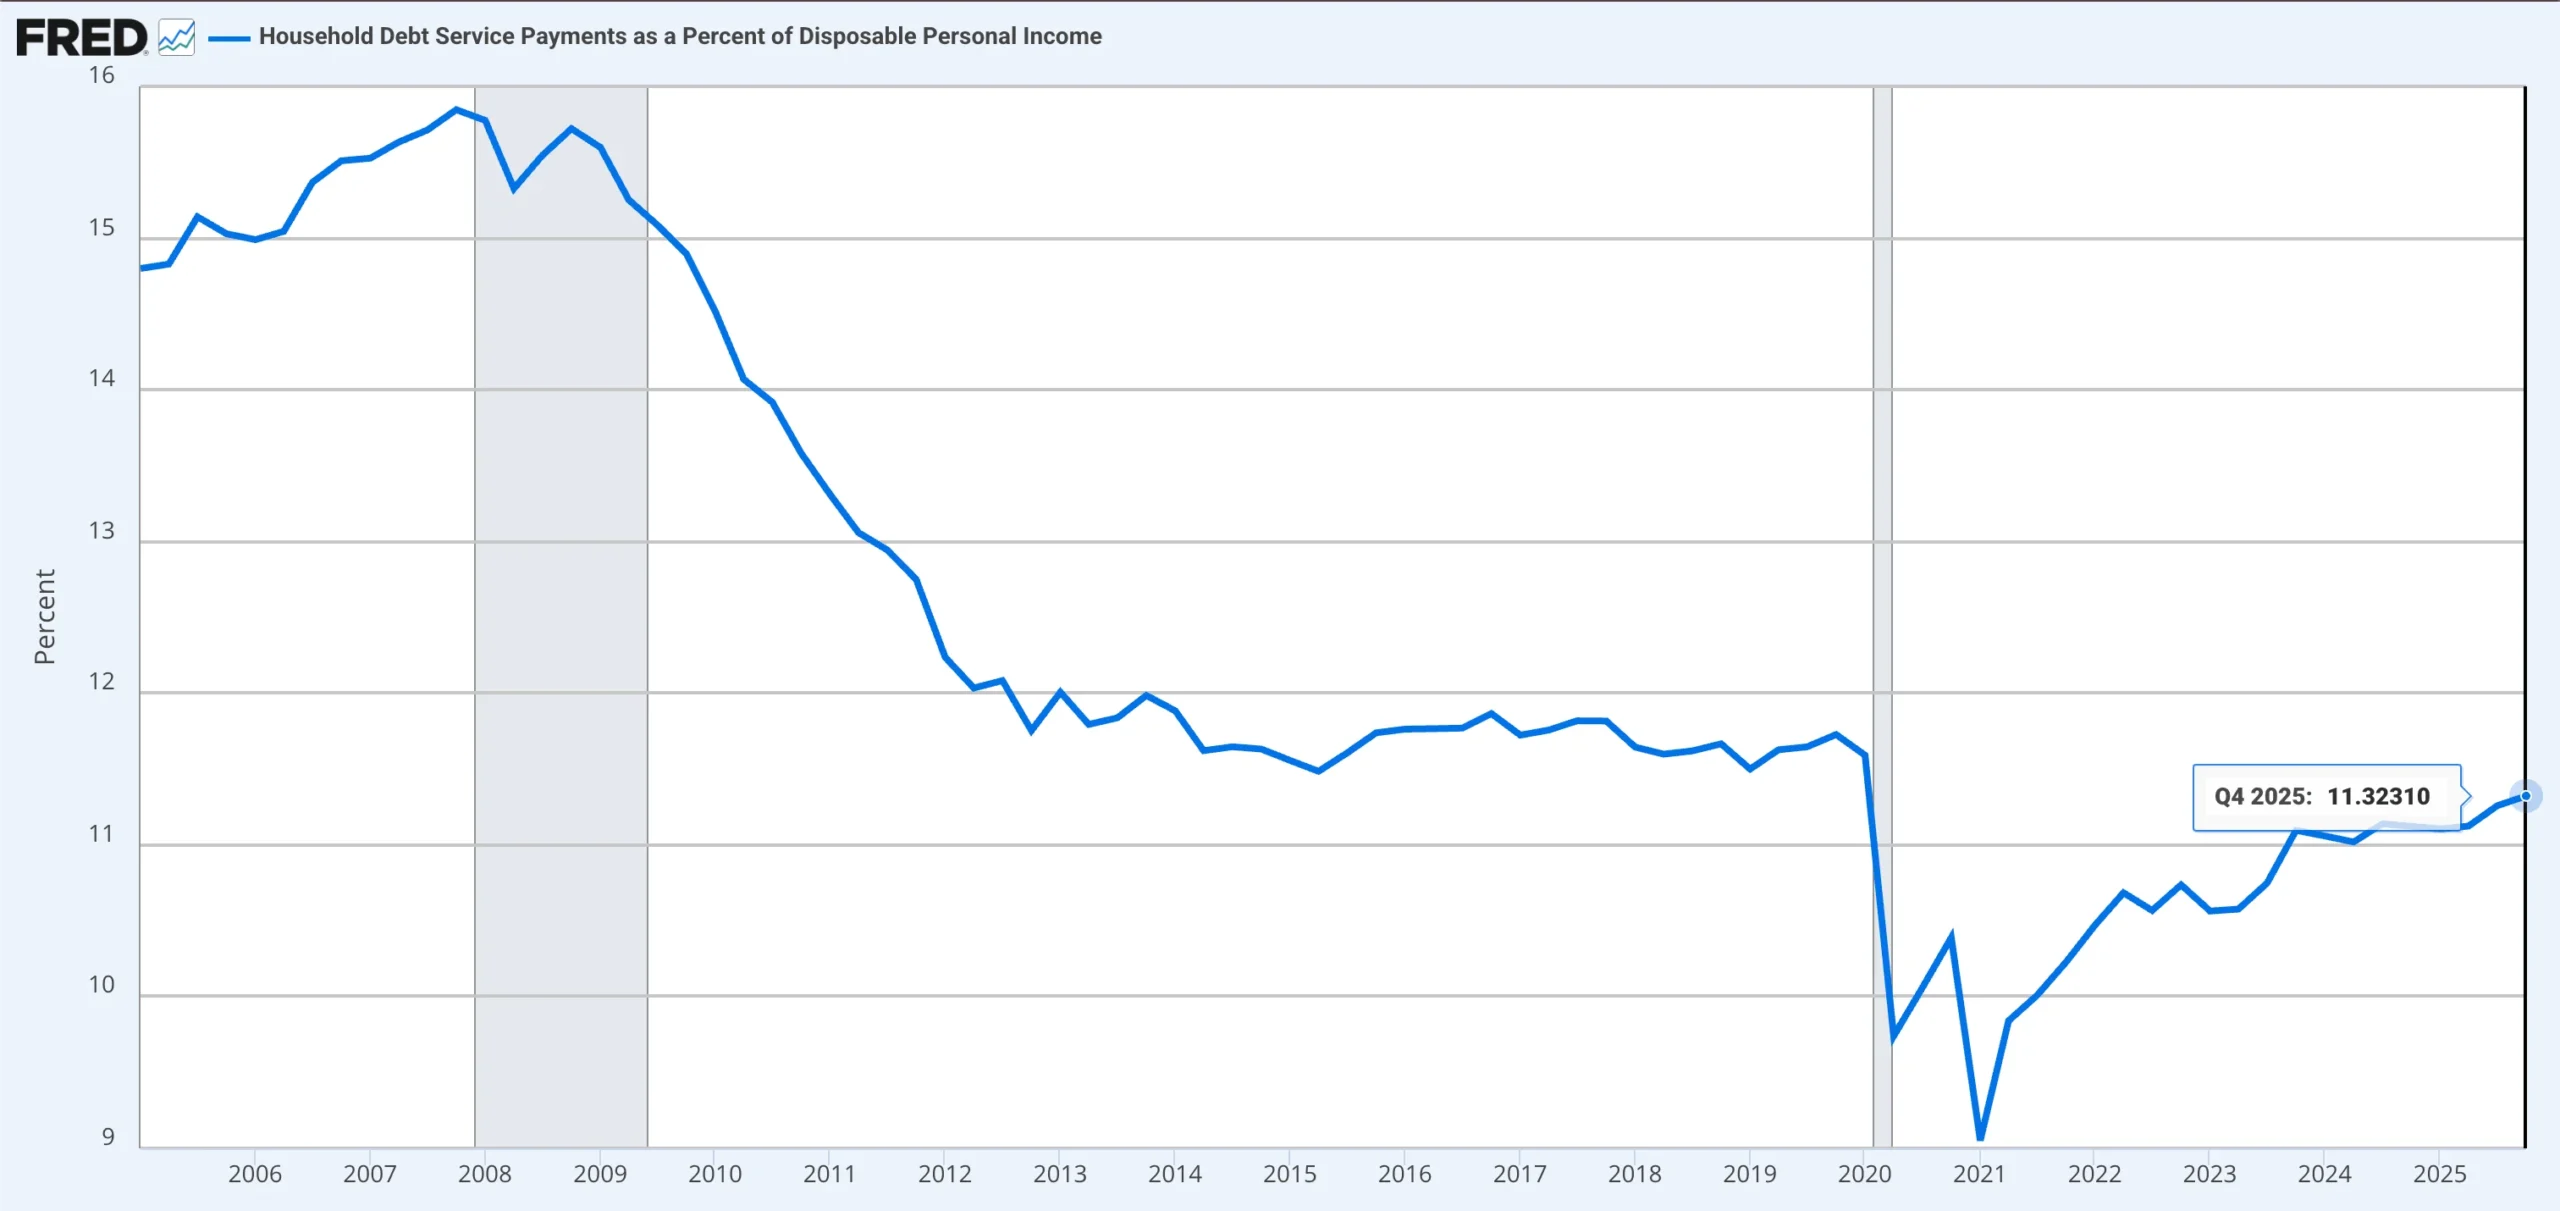 US Household Debt Service Ratio
Inflation often picks up because excess credit has fueled excess demand. Central banks raise rates. Asset prices stall or fall slightly. Marginal borrowers begin to default. The top is identifiable only in hindsight; while it’s happening, it looks like a normal pause.
Phase 3: The squeeze
Borrowers fall short on cash to service their debts. Their only option is to sell assets. But everyone is selling at the same time, so asset prices crash. Lower asset prices destroy collateral, which forces more selling, which pushes prices lower.
The wealth effect reverses violently: households that felt rich a year earlier now face margin calls, foreclosures, and bankruptcies. Bank balance sheets deteriorate; lending tightens; the contraction reinforces itself.
This is the point at which traditional monetary policy stops working. Cutting interest rates doesn’t help if no one is willing to borrow and banks aren’t willing to lend. The economy needs to deleverage, to reduce its debt burden relative to its income. That’s a different problem from a normal recession.
What Is Deleveraging?
Deleveraging is the painful process by which an economy reduces its total debt burden relative to its income. It’s fundamentally different from a recession.
In a recession, the fix is straightforward: the central bank cuts rates, credit becomes cheap, borrowing resumes, the economy reflates. In a deleveraging, rates are already at or near zero. There’s no room to cut further. The central bank is, in the standard expression, “pushing on a string.”
Dalio identifies four mechanisms an economy can use to deleverage. Every real-world episode is a blend of these four; the policy debate is mostly about how much weight to give each one.
1. Austerity
Households, businesses, and governments cut spending. The most intuitive response, pay down debt by spending less, but it has a brutal side effect. One entity’s spending is another’s income. When everyone cuts at once, aggregate income falls, which makes the existing debt harder to service. Austerity is strongly deflationary. The eurozone’s response to its 2010–2015 sovereign debt crisis leaned heavily on this approach.
2. Debt defaults and restructurings
Debts are wiped out, written down, or renegotiated. Lenders take losses; borrowers’ balance sheets reset. This works mechanically, less debt is less debt, but it destroys wealth and can cascade through the financial system if too many institutions default at once. The 2008 housing crisis featured this on a massive scale. Like austerity, it’s deflationary.
3. Wealth transfers
Governments raise taxes on the asset-holding class and redistribute income downward through spending or direct transfers. This eases the debt burden on indebted households but just redistributes who pays for it. Politically volatile by definition.
4. Money printing (debt monetization)
The central bank creates new money and uses it to buy government debt, modern versions of this are called quantitative easing. This is the inflationary lever.
The newly created money helps offset the deflationary forces of the other three mechanisms. Done right, it stabilizes the financial system without setting off runaway inflation. Done wrong, it produces Weimar Germany, Zimbabwe, or Venezuela.
The first three mechanisms are deflationary; the fourth is inflationary. The art of managing a deleveraging is balancing them.
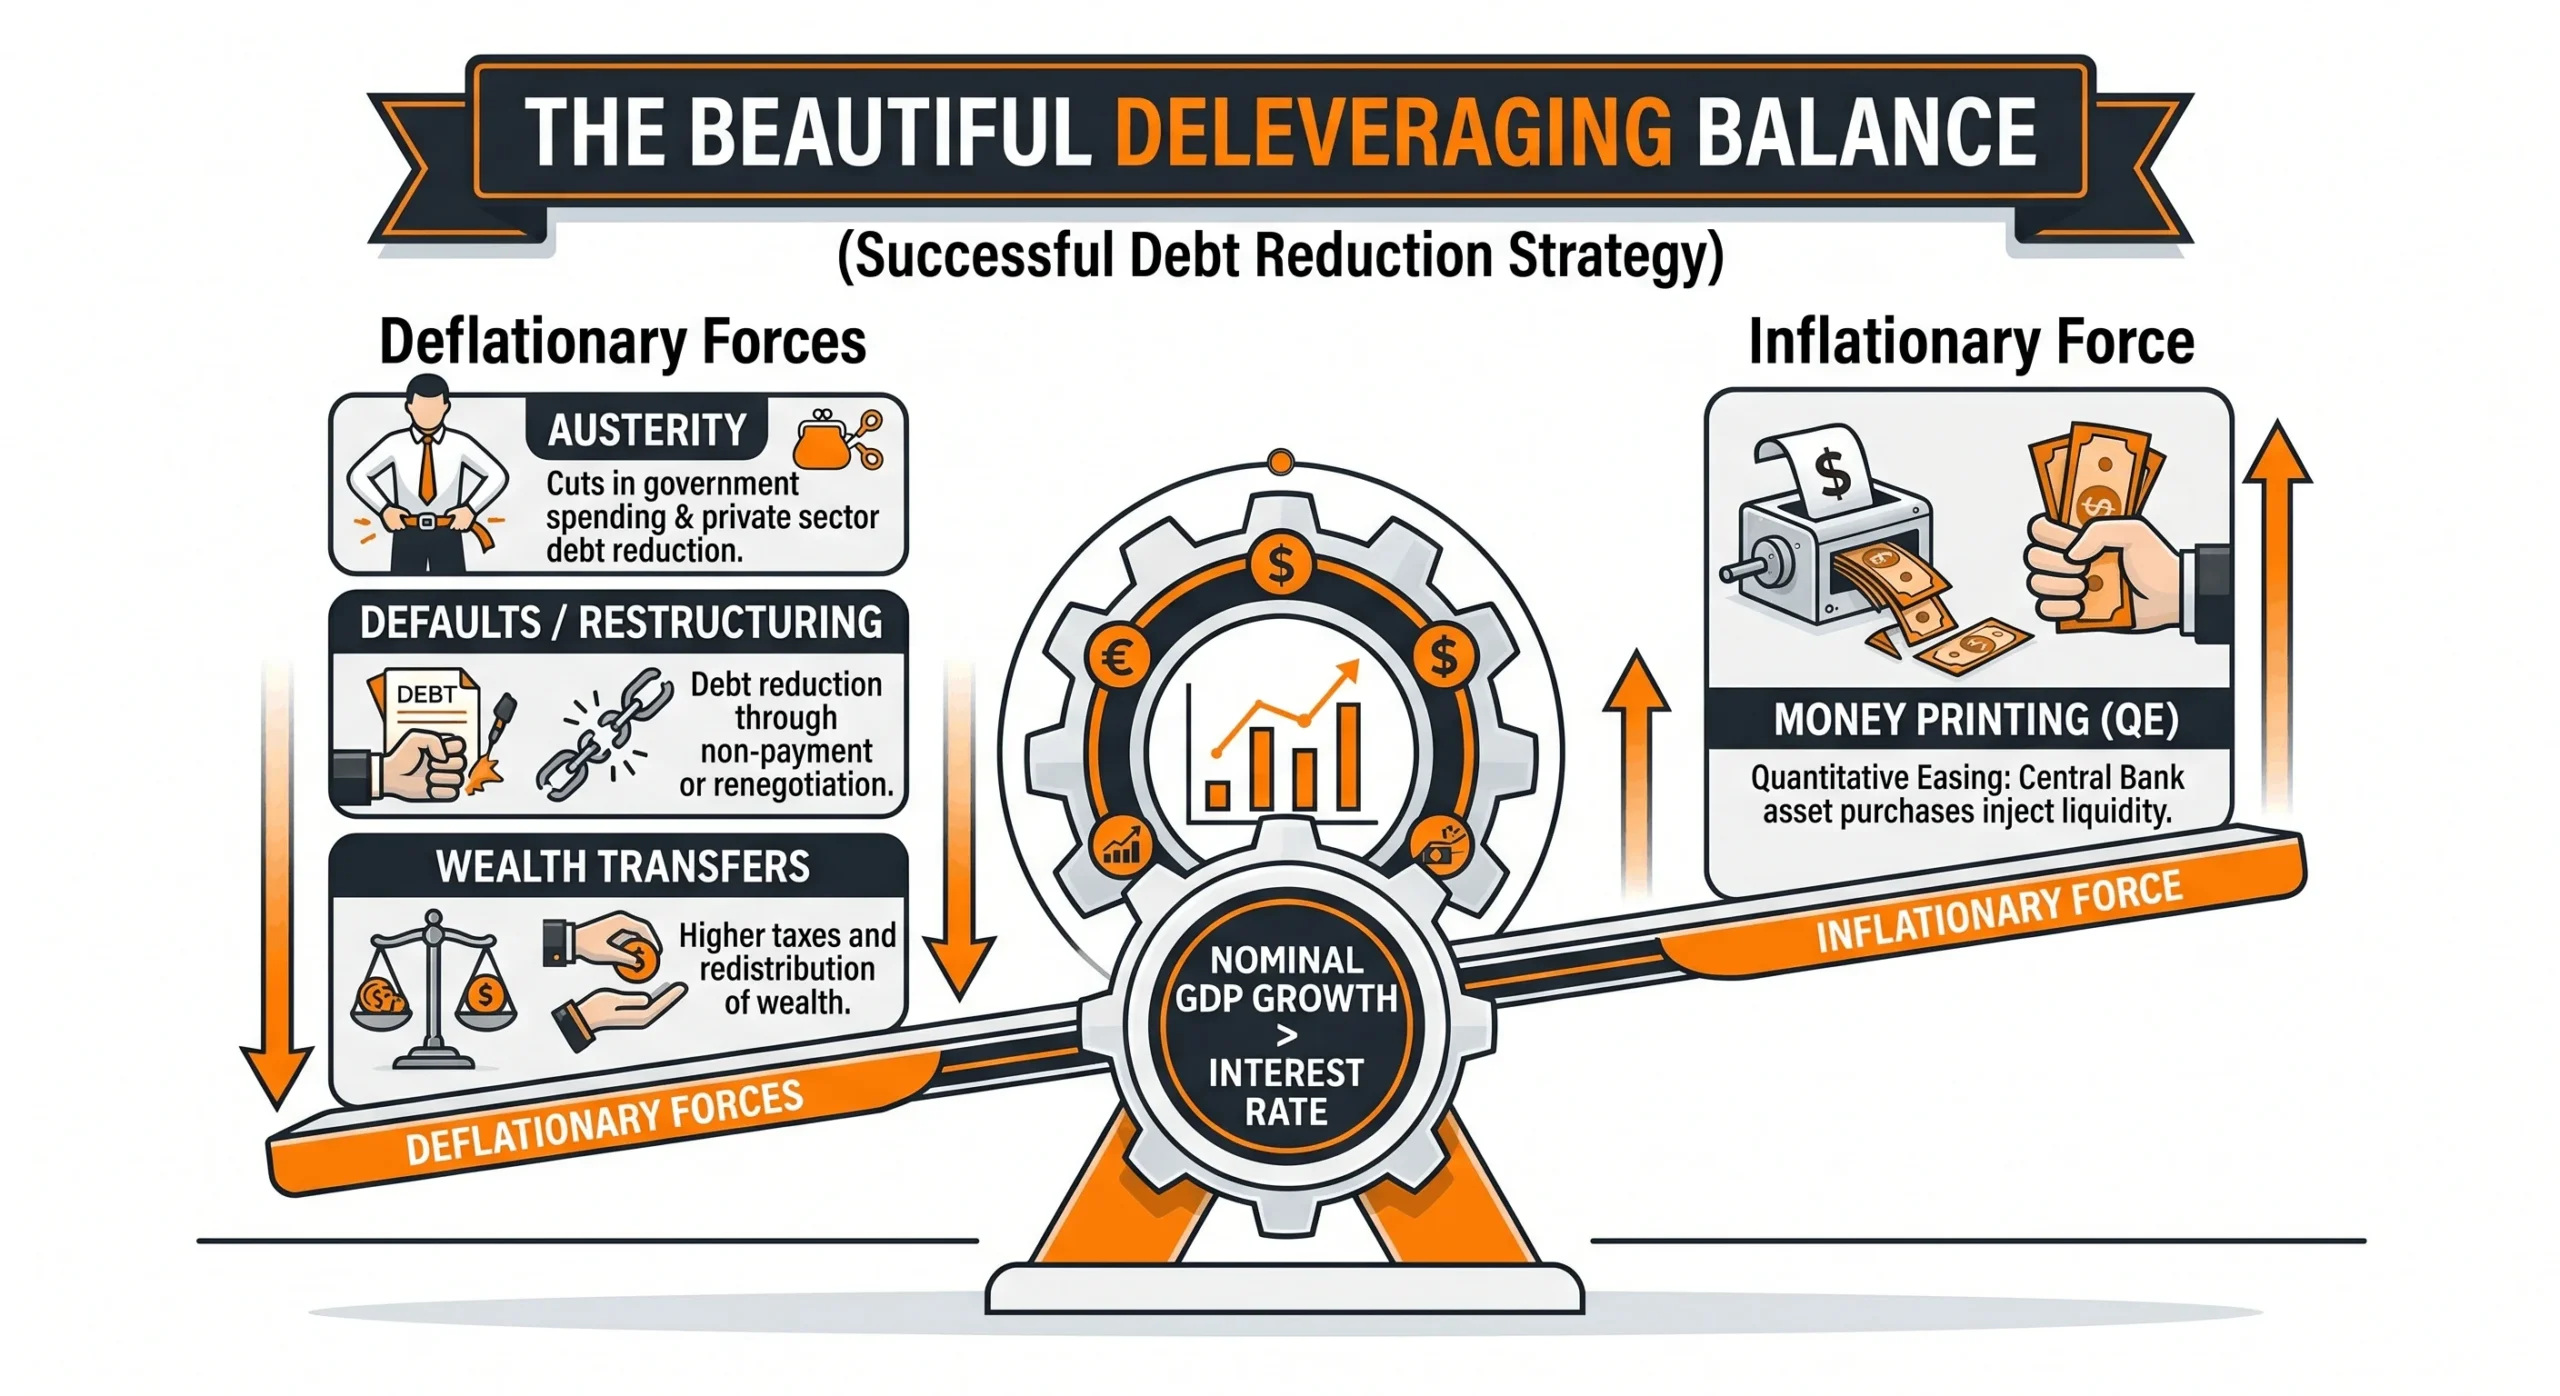
The “Beautiful Deleveraging” Explained
A “beautiful deleveraging,” Dalio’s term, is the rare case where policymakers blend the four mechanisms successfully. The deflationary forces of austerity, defaults, and wealth transfers are offset by the inflationary force of money printing in such a way that nominal economic growth runs slightly above the nominal interest rate. When that happens, the debt-to-income ratio declines gradually, the financial system stabilizes, and the economy avoids both a deflationary depression and runaway inflation.
The conditions are narrow. Money printing has to be aggressive enough to offset deflation but restrained enough not to undermine the currency. The deflationary mechanisms have to bear enough load that real debt levels fall. And policymakers have to navigate all of this through a political environment where each mechanism creates its own losers.
 The “Beautiful Deleveraging” Balance
The post-2008 US deleveraging is often cited as approximately “beautiful.” The Fed deployed three rounds of QE that monetized large portions of new Treasury debt; the financial system absorbed defaults and restructurings (especially in housing); fiscal stimulus and unemployment insurance softened the income hit.
Inflation stayed below the Fed’s 2% target throughout, while the debt-to-GDP ratio for the household sector fell meaningfully. The federal government’s debt-to-GDP ratio, however, rose sharply, which is part of why we’re in the late stages of the long-term cycle rather than its early stages.
The Danger of Debt Deflation: Irving Fisher’s Warning
The academic backbone of why deleveraging is so dangerous comes from a 1933 paper by Yale economist Irving Fisher: “The Debt-Deflation Theory of Great Depressions,” written in the depths of the Great Depression.
Fisher’s framework remains one of the cleanest descriptions of why a credit-fueled bubble can produce a self-reinforcing collapse, and why central banks since then have been terrified of deflation.
 Fisher’s Debt-Deflation Spiral
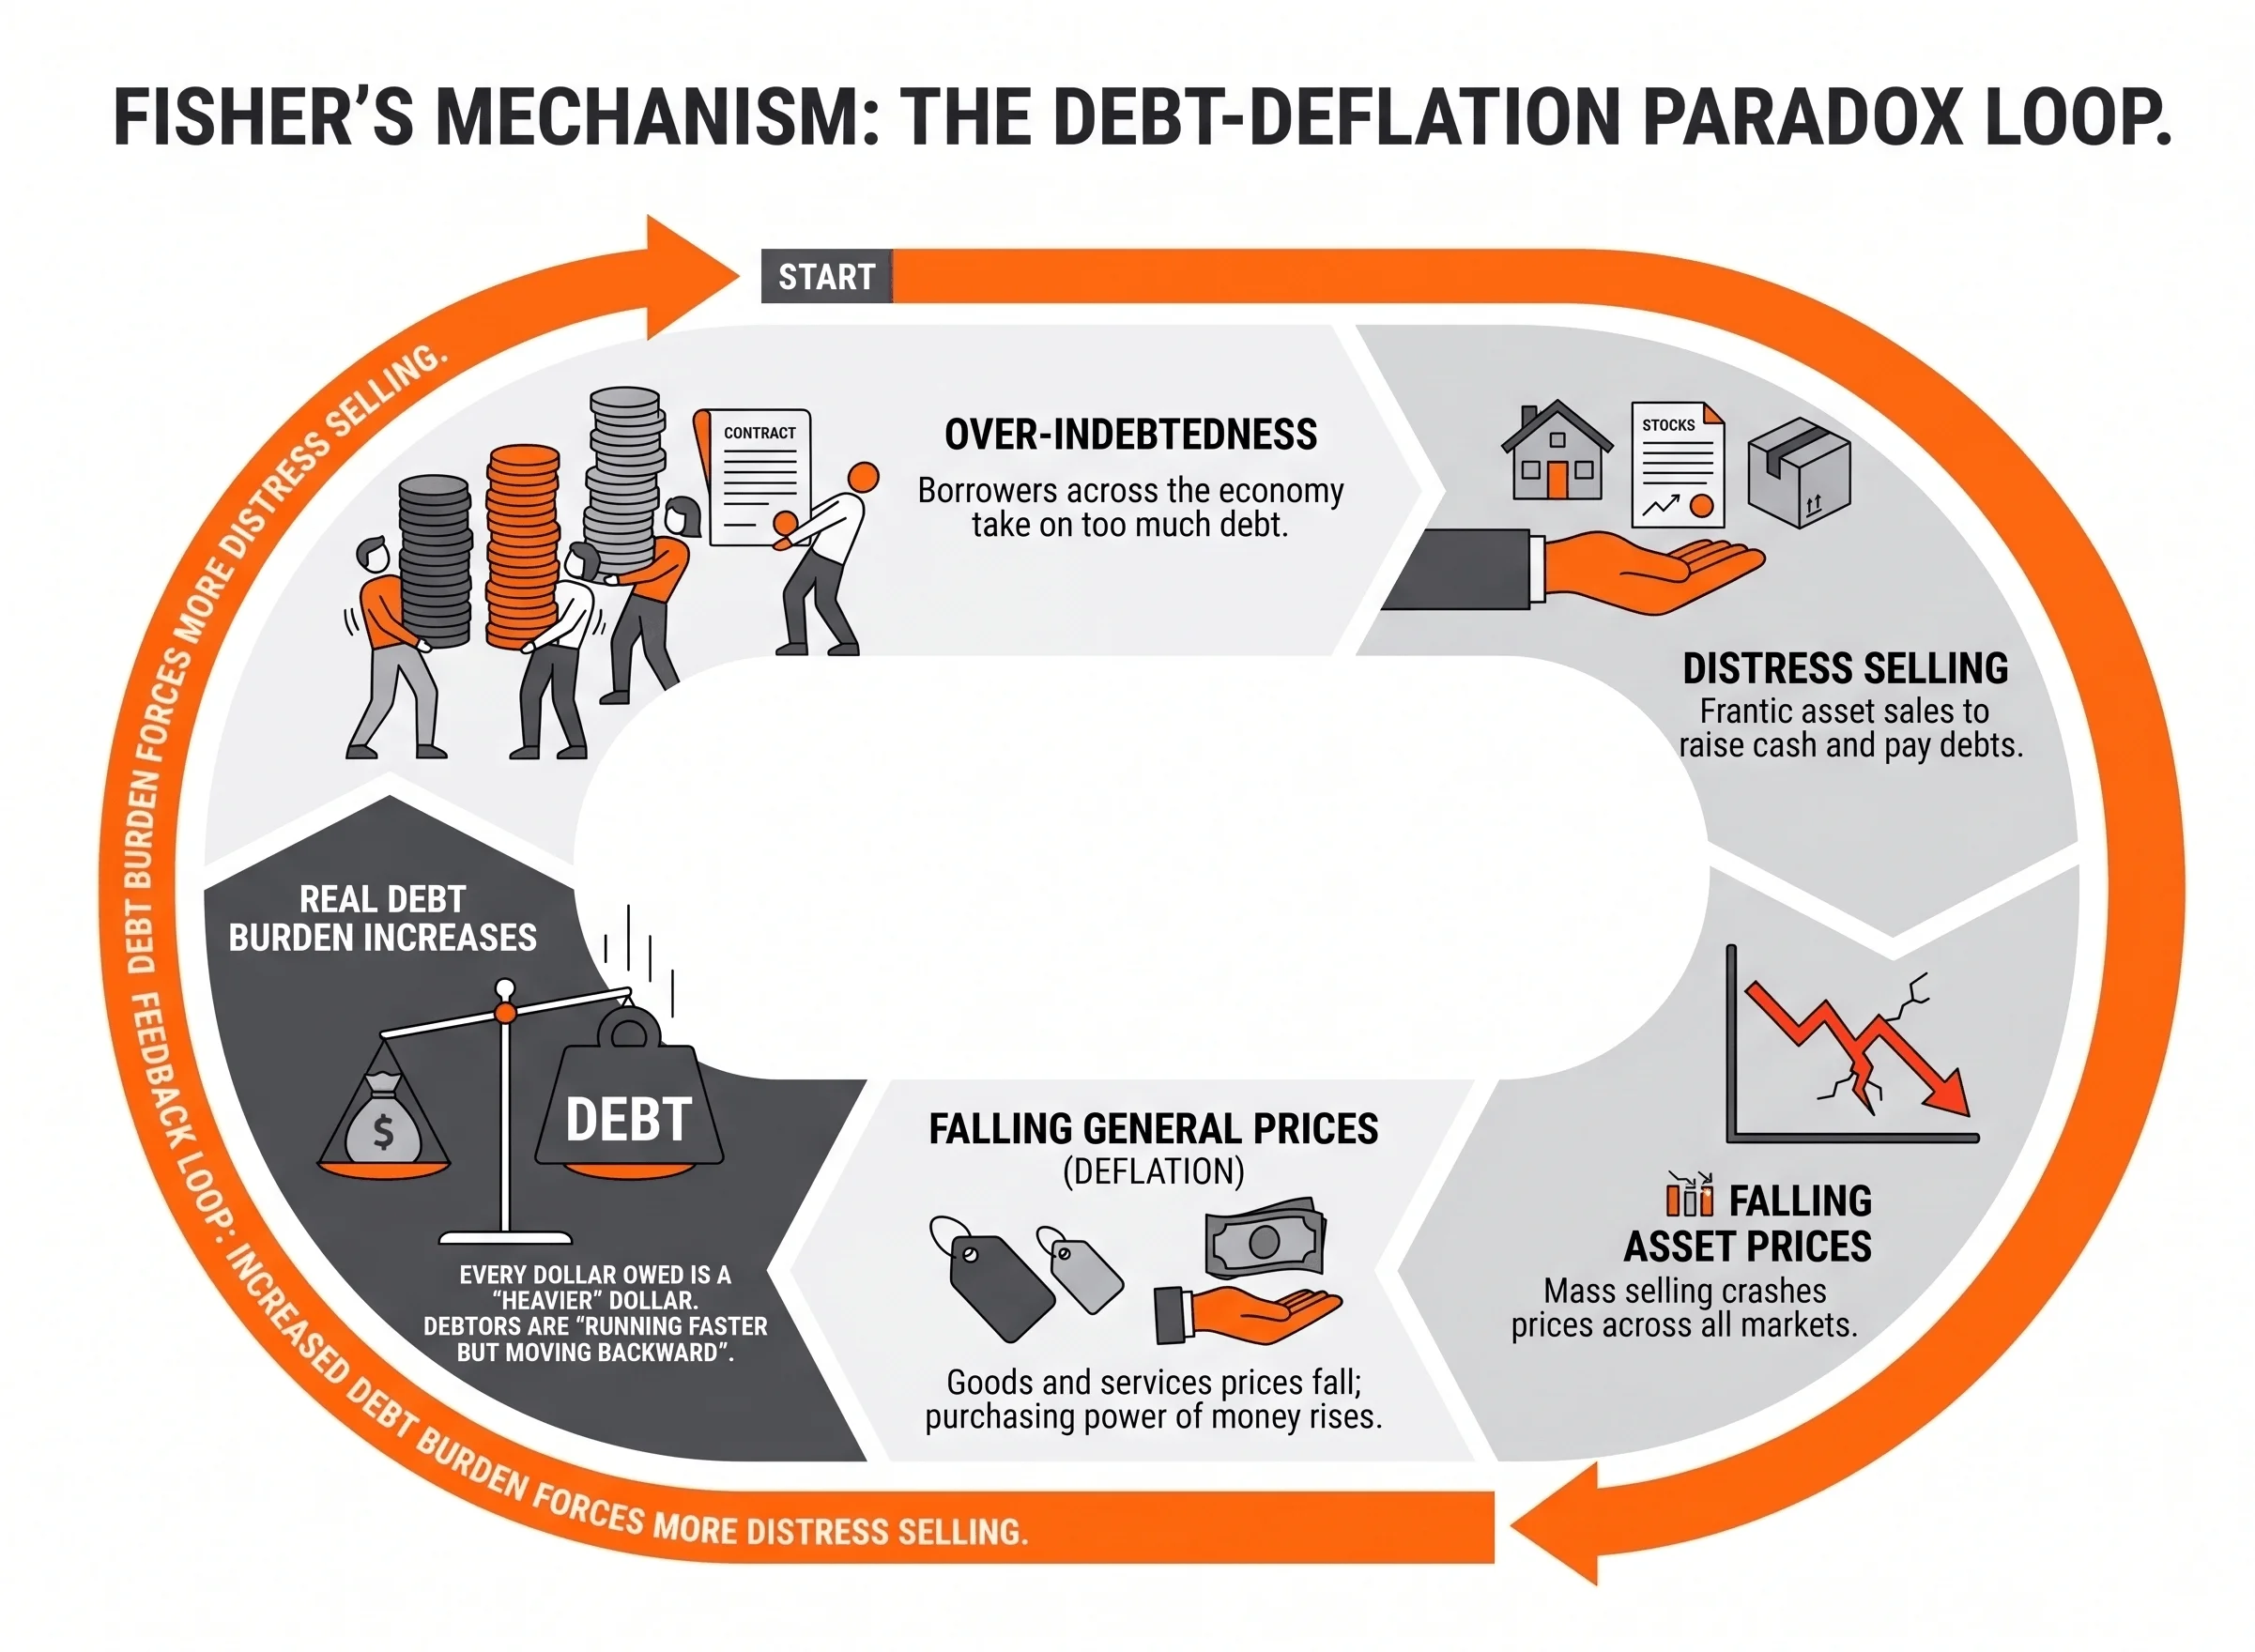
Fisher’s mechanism is a paradox. Walk through it step by step:
- Over-indebtedness: Borrowers across the economy have taken on too much debt.
- Distress selling: They sell assets (stocks, real estate, inventory) to raise cash and pay down debt.
- Falling asset prices: Mass selling pushes prices down across markets.
- Falling general price level (deflation): As prices of goods and services fall along with assets, the purchasing power of money rises.
- The paradox: because money is now worth more, the real value of any remaining debt increases. Debtors are running faster but moving backward, every dollar they still owe has become a heavier dollar.
- More distress selling: The increased real debt burden forces more selling, which depresses prices further, which raises the real value of debt further.
The loop only stops when enough debt has been defaulted or wiped out, or when policy intervenes aggressively enough to halt the price decline. Fisher’s policy implication (reflate prices, almost regardless of the cost) became one of the foundations of modern central banking.
It’s why the Fed acted on the scale it did in 2008 and at unprecedented speed in 2020. The fear of debt-deflation is what justifies the modern central-bank toolkit, and why mild inflation is now treated as a feature, not a bug.
How to Track the Credit Cycle Yourself
The data is free and most of it lives on FRED.
- Total Debt-to-GDP (GFDEGDQ188S): Federal debt as a percentage of GDP. The single most important long-term-cycle indicator. The chart shows the long-term cycle clearly: low post-WWII, rising since the early 1980s, sharply higher post-2008 and post-2020.
- Household Debt Service Ratio (TDSP): Household debt payments as a percentage of disposable income. When this rises sharply, household credit stress is building.
- The yield curve: When short-term interest rates rise above long-term rates (an “inverted” yield curve), the bond market is signaling that the short-term credit cycle is near its end. Inversions have preceded every US recession in the past 60 years, with a lag of 6 to 18 months.
- Corporate credit spreads: The gap between yields on safe Treasury bonds and risky corporate bonds. When the spread widens, credit conditions are tightening and risk appetite is falling.
- BIS Credit-to-GDP Gap: The Bank for International Settlements tracks this for every major economy. A positive gap means private credit is growing faster than long-run trend; sustained positive gaps have historically preceded banking crises.
No single metric tells the whole story. Watched together, these signals describe the credit cycle’s current temperature with reasonable fidelity.
How Debt Cycles and Deleveraging Affect Bitcoin
Bitcoin’s relationship with debt cycles is more complex than many advocates admit. In the early stages of a deleveraging, Bitcoin often behaves less like digital gold and more like a risk asset.
When markets panic, investors sell what they can. Margin calls, debt repayments, and liquidity shortages create a desperate demand for cash. Bitcoin is often sold alongside stocks and commodities. During the March 2020 COVID crash, it lost more than 50% of its value in just days.
This is the debt-deflation phase described by economist Irving Fisher: overleveraged investors are forced to raise cash, triggering broad-based selling. Bitcoin’s monetary properties don’t make it immune.
The more important relationship comes later. Modern deleveragings are typically followed by debt monetization and money creation. After the 2008 financial crisis, central banks launched massive quantitative easing programs. In 2020, the Federal Reserve expanded its balance sheet by trillions while governments ran record deficits.
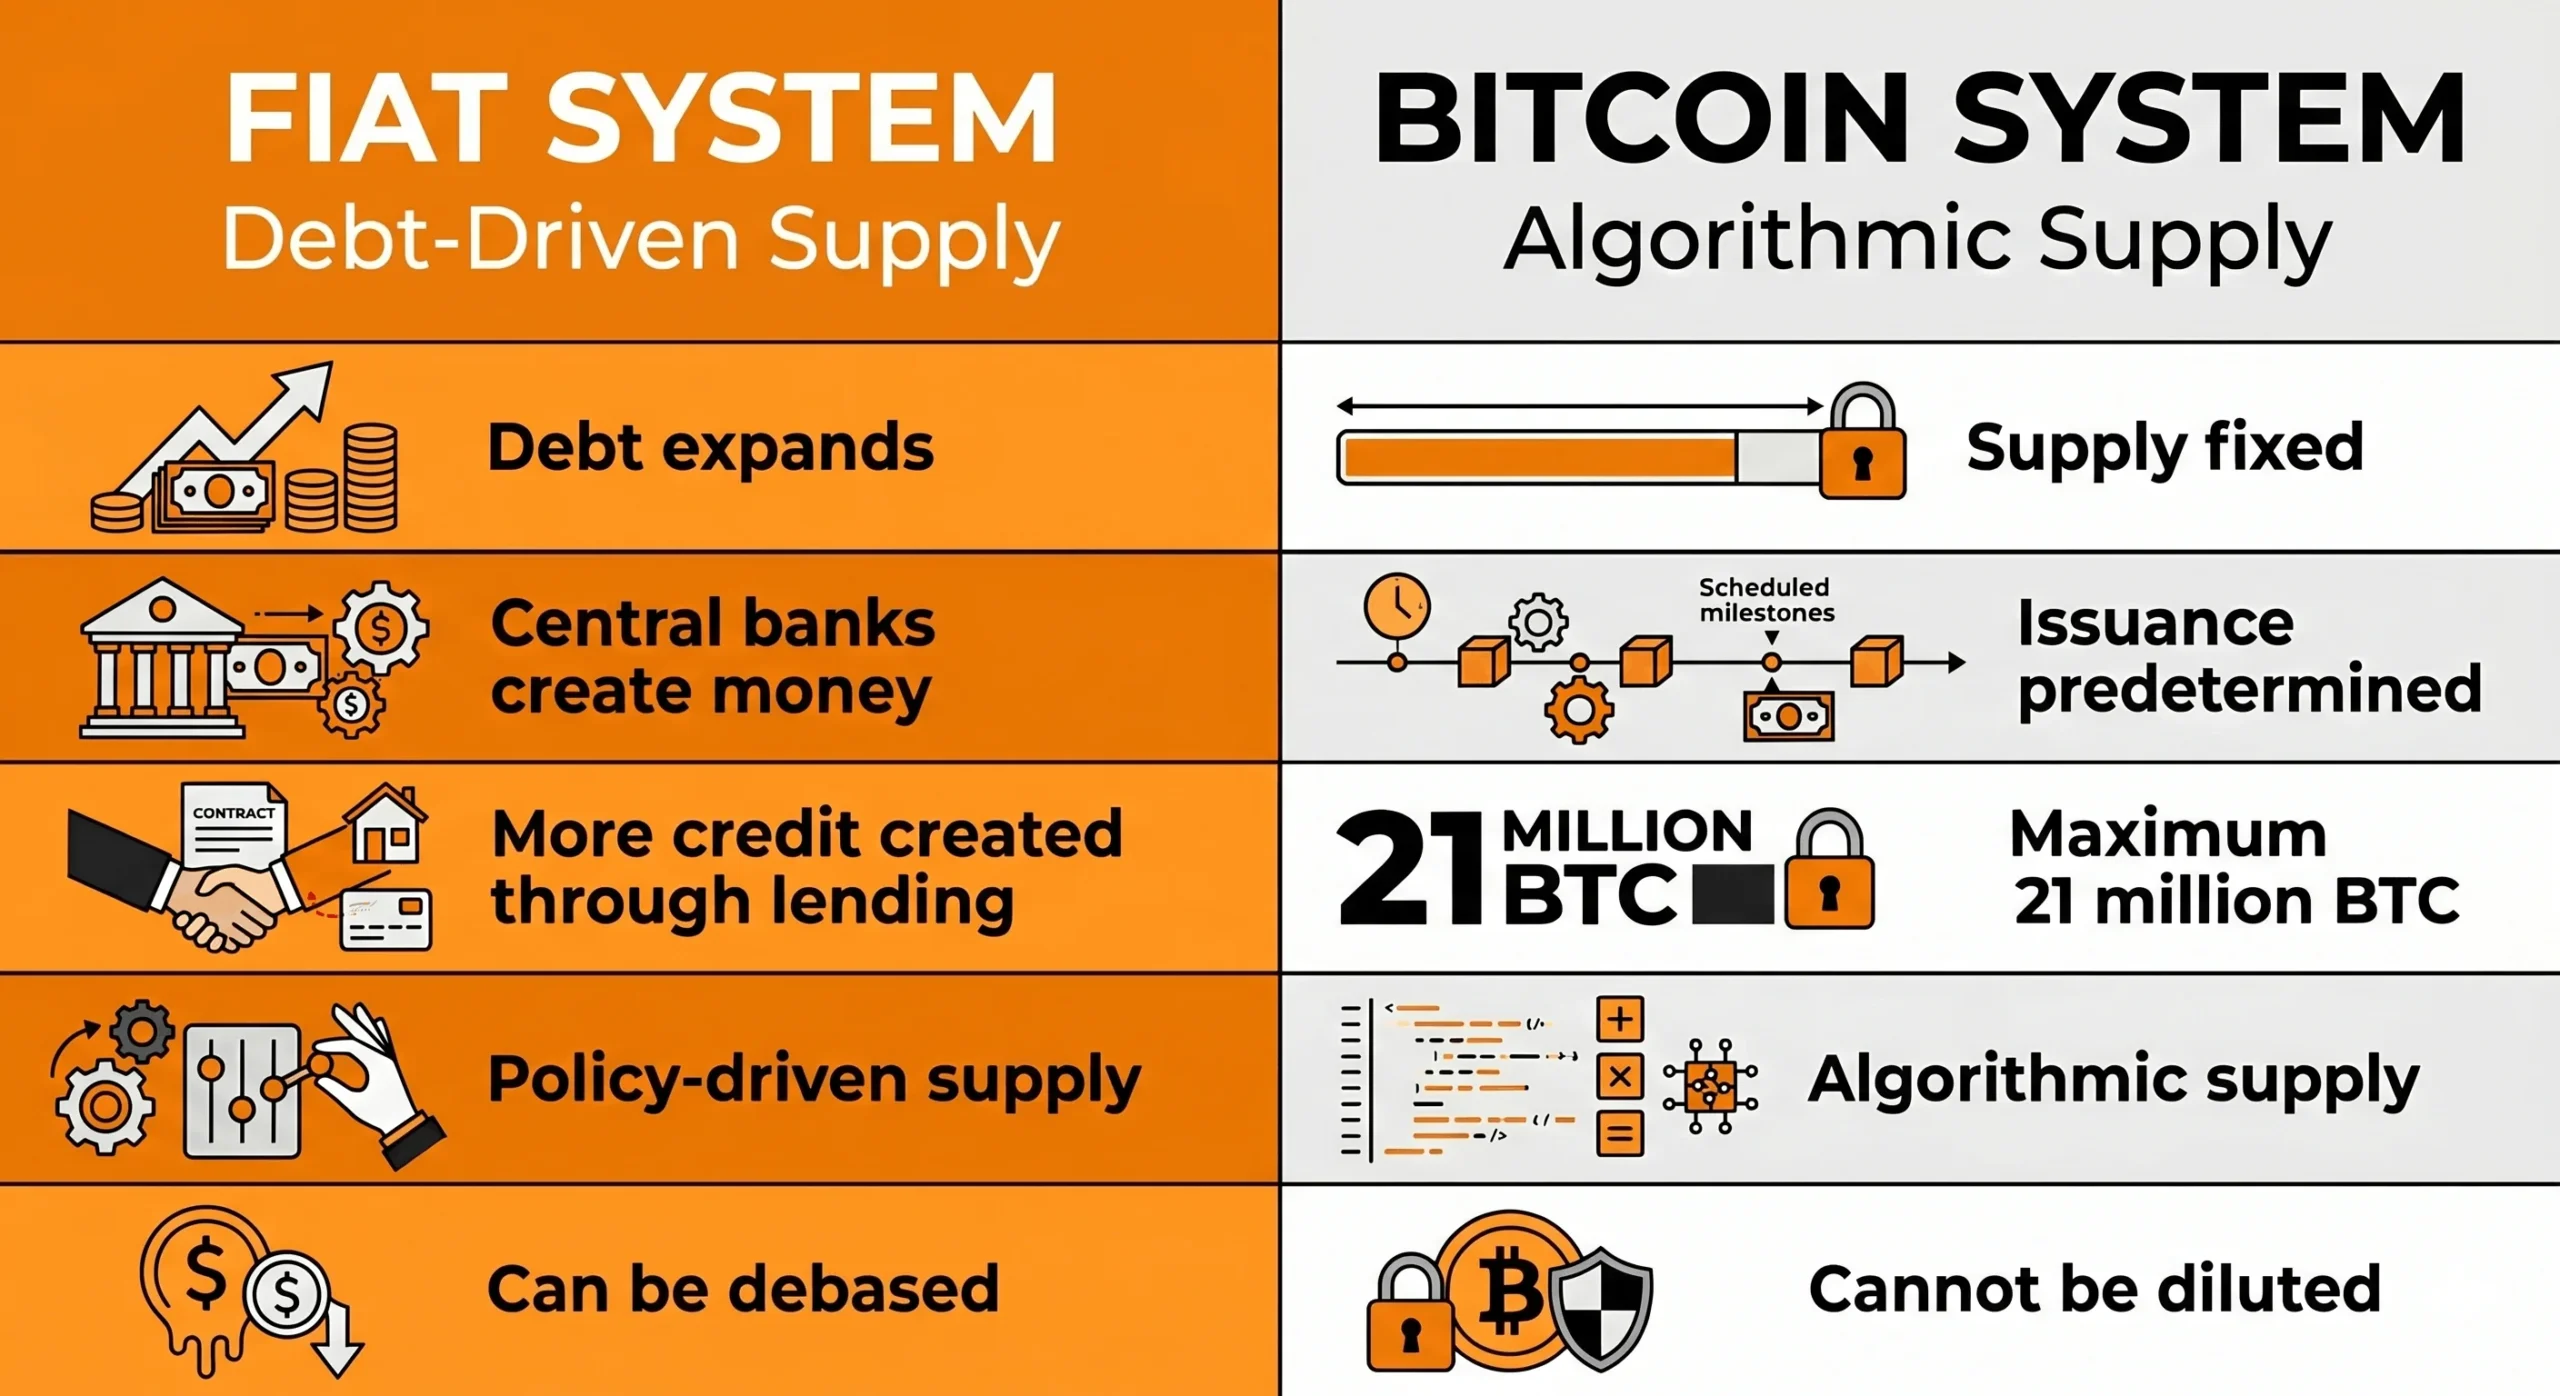 Fiat vs. Bitcoin Monetary Systems
This is where Bitcoin’s long-term thesis connects to debt-cycle theory. Like gold, Bitcoin exists outside the credit system. Its supply is fixed at 21 million coins, regardless of how much debt governments accumulate or how aggressively central banks expand the money supply. As policymakers increasingly rely on money creation to stabilize debt-heavy economies, scarcity becomes more valuable.
That doesn’t mean Bitcoin rises every time money is printed. Regulation, liquidity, adoption, and sentiment all matter. But over long periods, rising debt has often led to monetary expansion, and monetary expansion has historically favored scarce assets.
Viewed through Ray Dalio’s debt-cycle framework, Bitcoin occupies a unique position: vulnerable during the deflationary phase when investors need cash, but potentially strengthened by the inflationary policies that often follow.
The pattern is simple: Bitcoin can suffer during the crisis, then benefit from the response. For investors, that’s the key lesson. Bitcoin isn’t just reacting to today’s interest rates. It’s increasingly being valued against the long-term trajectory of debt, money creation, and currency debasement.
Conclusion
Debt cycles are the heartbeat of the modern fiat economy. The short ones, recessions and recoveries, get most of the attention; the long ones determine which decades feel like booms and which feel like the slow grind of a deleveraging.
Right now, US federal debt sits above 120% of GDP (past the 1946 WWII peak that defined the previous record) interest costs have crossed $1 trillion a year for the first time, and the long-term cycle is visibly mature.
None of that tells you what happens next. But understanding the framework (short-term versus long-term, the four mechanisms of deleveraging, Fisher’s paradox) is the difference between watching the macro news cycle and actually reading it.